Ethereum’s Leverage Crash: Are Derivative Traders Facing a Massive Downturn?

- A withdrawal of 375,000 ETH from derivative exchanges reflects speculative decline and a shift toward spot trading strategies.
- Lower open interest reached $22 billion, indicating reduced derivative activity since November, as traders exit positions and de-risk.
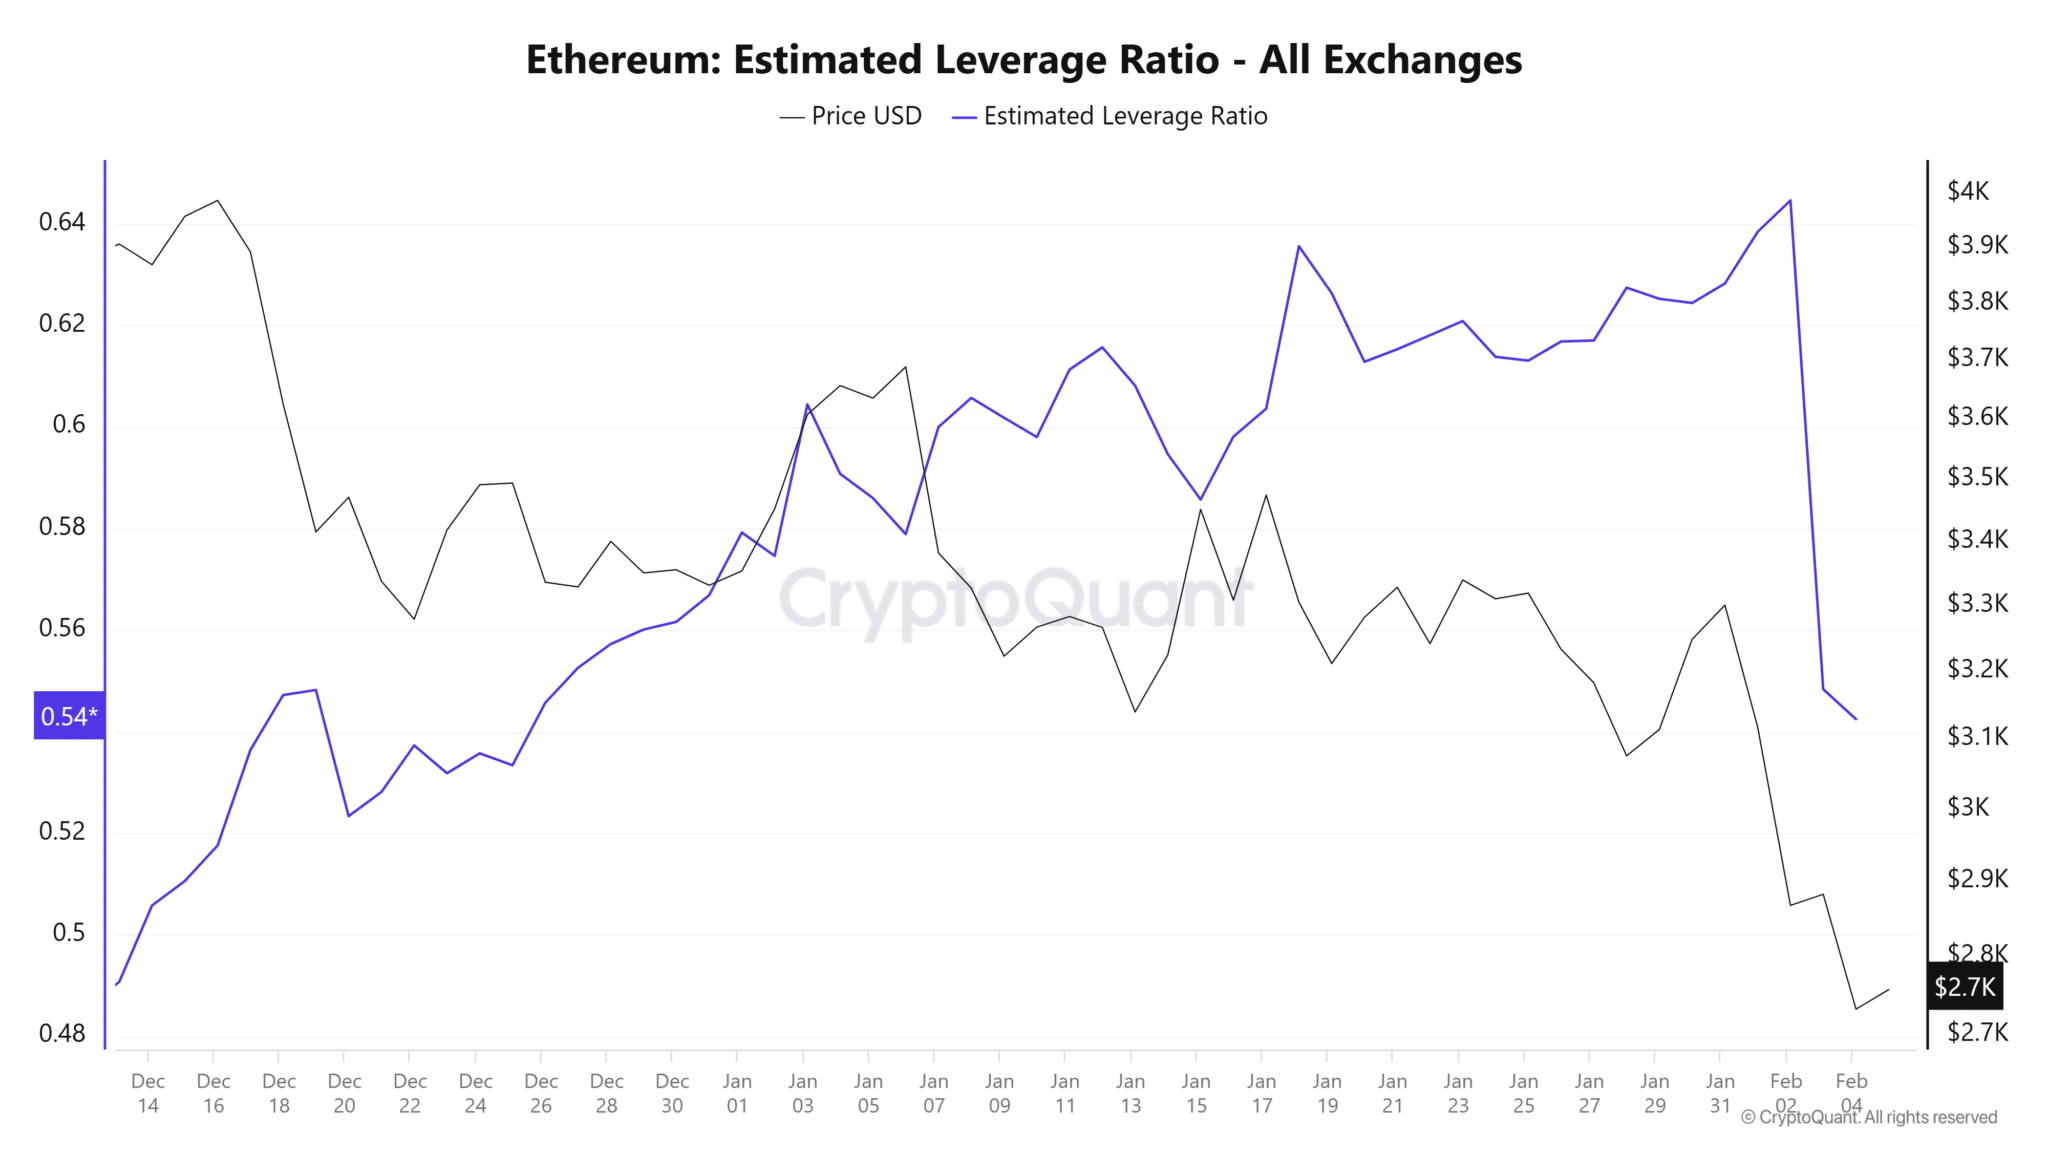
Ethereum’s derivatives markets have displayed clear shifts in trader behavior following recent price fluctuations. Data from Coinglass analytics platforms shows a 15% decrease in Ethereum’s estimated leverage ratio over two days, dropping from 0.64 to 0.54. This metric, which measures borrowed capital relative to total positions, reflects reduced speculative activity.
 Source: CryptoQuant
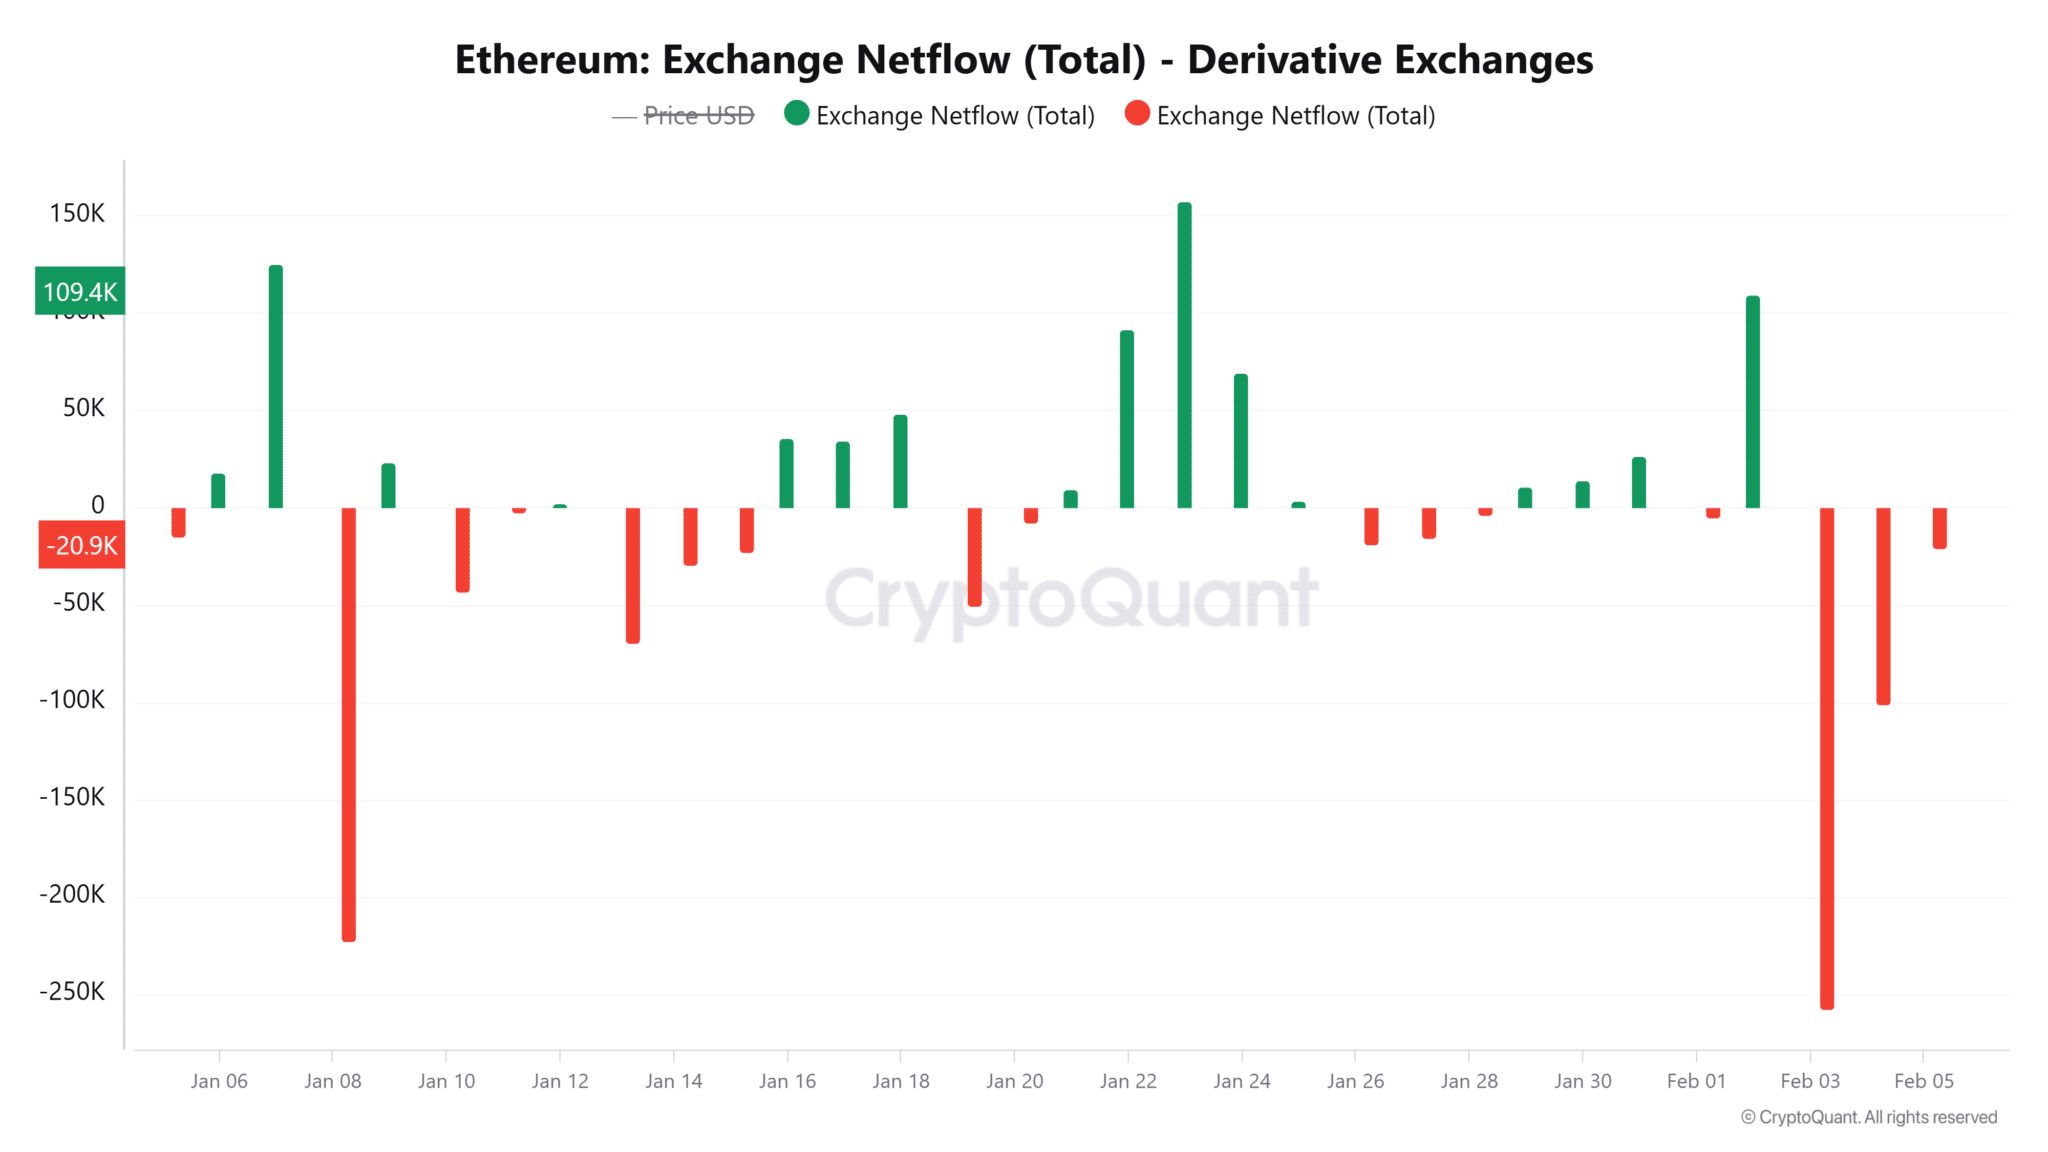
Concurrently, 375,000 ETH left derivative exchanges in three days, marking the largest withdrawal since November. These movements coincide with Ethereum’s price volatility, including a five-month low of $2,160 earlier this week and a rebound to $2,760 at publication.
 Source: CryptoQuant
The decline in leverage aligns with falling open interest, now at $22 billion. Reduced borrowing suggests traders are closing positions to avoid further losses after liquidations. Historical patterns indicate that Ethereum’s price often declines when leverage contracts, as fewer new positions signal weakened confidence . While this trend may pressure prices downward, it also lowers liquidation risks, potentially stabilizing volatility.
Parallel withdrawals from derivatives and inflows to spot exchanges point to a broader shift. Traders appear to be selling ETH directly in spot markets rather than maintaining leveraged bets. This transition could amplify selling pressure but reduces reliance on borrowed funds, creating a dual effect: short-term bearish sentiment offset by reduced systemic risk.
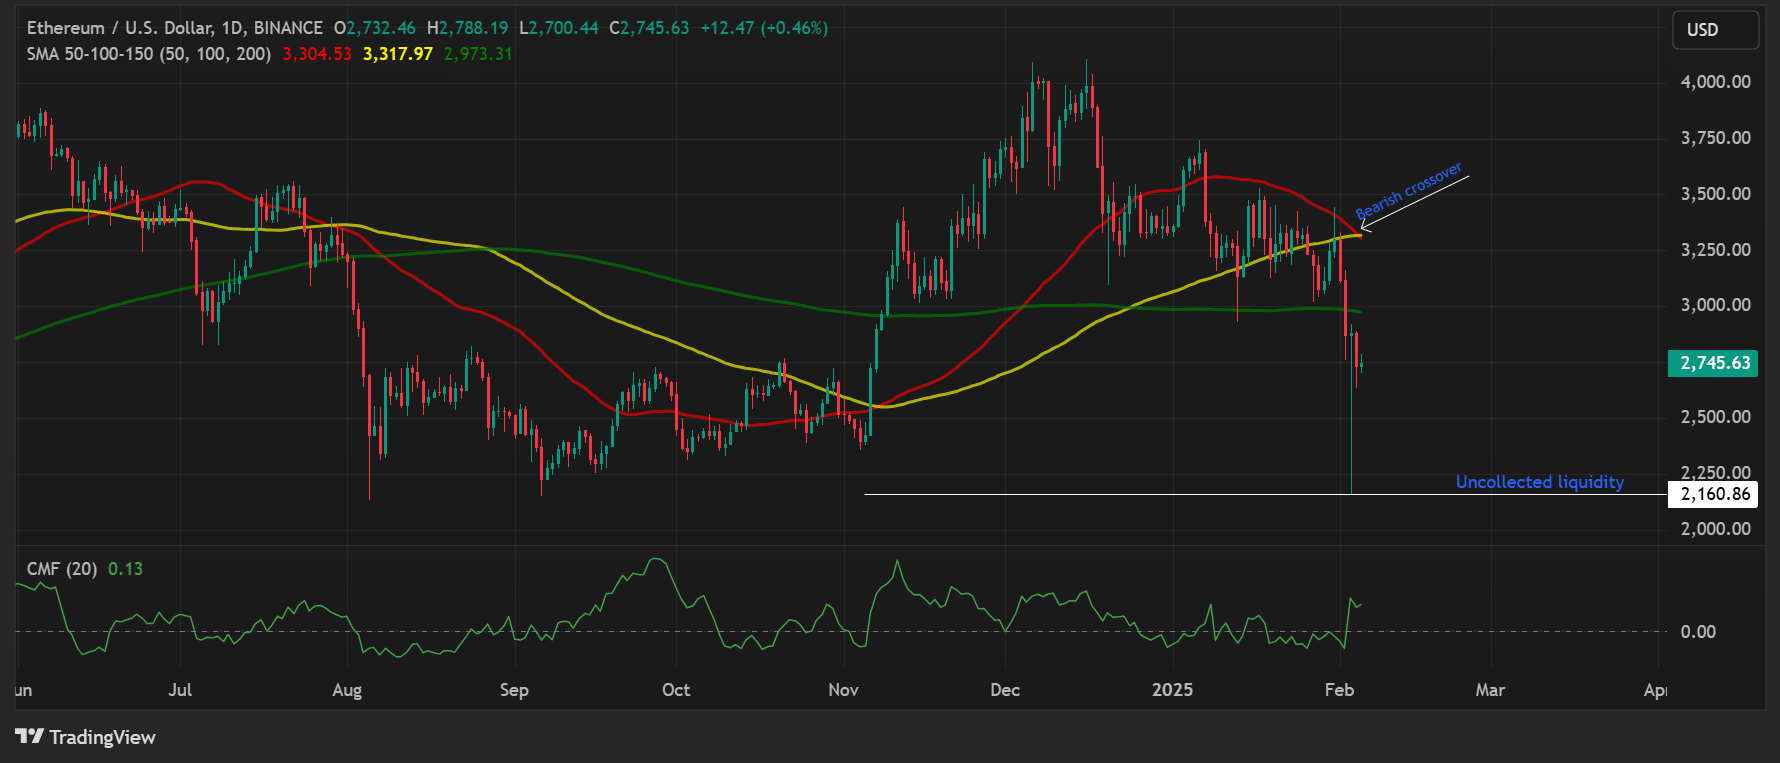
A bearish crossover occurred on Ethereum’s one-day chart as the 50-day Simple Moving Average (SMA) dipped below the 100-day SMA, signaling strengthening downward momentum. However, the Chaikin Money Flow (CMF), which tracks buying and selling pressure, remains positive . This divergence implies underlying demand persists despite bearish technicals.
 Source: Tradingview
For Ethereum to reverse its trajectory, analysts identify two key resistance levels. The first lies at the 200-day SMA ($2,973), a threshold historically linked to bullish breaks. A sustained move above this level could shift sentiment. The second resistance sits at the 50-day SMA ($3,304), where a breakout might reignite upward momentum. Until then, the derivatives exodus and leverage unwind suggest traders are bracing for further turbulence.
ETHNews current data underscores a market caught its breath, balancing caution with pockets of optimism. While reduced leverage limits immediate volatility, Ethereum’s path forward hinges on reclaiming technical levels and renewed confidence from derivatives participants.
Disclaimer: The content of this article solely reflects the author's opinion and does not represent the platform in any capacity. This article is not intended to serve as a reference for making investment decisions.
You may also like
Is Trump Pro-Crypto? Only One-Third of Australians Think So

Bitcoin’s Next Major Top Projected for February 2026
The Pi Cycle Top Indicator signals a potential Bitcoin peak in February 2026, with a projected price of $258K per BTC.Understanding the Pi Cycle Top IndicatorWhat This Means for Investors

M2 Global Liquidity Rises Again: Will Alts Follow
M2 global liquidity is rising again after peaking in Dec 2024. Will altcoins start catching up soon? Here's what to expect.Altcoins Lag Behind But May Soon Catch UpWhat to Expect Next?

Bitcoin & The Everything Bubble: Why Smart Investors Are Buying
As the Everything Bubble crashes, Bitcoin is set for a fast recovery. Here’s why investors like Robert Kiyosaki are buying the dip.Why Bitcoin Will Recover FirstWhat’s Your Post-Crash Plan?