
- Bitcoin Cash is expected to trade between $430 and $520 in 2025, with key resistance at $400-$420 determining future price movement.
- A breakout above $400 could push BCH towards $500+, while failing to hold above $360-$380 may lead to consolidation.
- The $300-$320 support zone remains crucial, as a breakdown below could indicate further downside risk.
Bitcoin Cash (BCH) is a cryptocurrency that emerged from a hard fork of Bitcoin on August 1, 2017. This split was primarily driven by differing opinions within the Bitcoin community regarding scalability solutions. While Bitcoin maintained a block size limit of 1 MB, Bitcoin Cash increased this limit to 8 MB at its inception, and later to 32 MB in May 2018, allowing for more transactions per block and aiming to reduce transaction fees and confirmation times.
The larger block size in Bitcoin Cash enables the network to process more transactions per second compared to Bitcoin, aligning with its goal to function as a peer-to-peer electronic cash system. However, this approach has led to debates about the potential for increased centralization, as larger blocks require more storage and bandwidth, potentially limiting participation to those with more substantial resources.
In November 2018, Bitcoin Cash underwent another split, resulting in two separate cryptocurrencies: Bitcoin Cash (BCH) and Bitcoin Satoshi Vision (BSV). This division stemmed from disagreements over technical updates and the future direction of the network.
As of December 2024, Bitcoin Cash continues to be recognized and utilized within the cryptocurrency space. For instance, Frankenmuth Credit Union expanded its cryptocurrency offerings to include Bitcoin Cash, among others, reflecting a growing acceptance and integration of BCH into various financial platforms.
Overall, Bitcoin Cash represents an alternative vision to Bitcoin, focusing on increasing transaction capacity to serve as a more efficient medium of exchange. Its development and adoption continue to evolve, contributing to ongoing discussions about scalability, decentralization, and the future of digital currencies.
Table of contents
- Bitcoin Cash (BCH) Price Prediction 2025-2030 Overview
- Bollinger Band Analysis for Bitcoin Cash (BCH)
- MACD Analysis for Bitcoin Cash (BCH)
- Relative Strength Index (RSI) Analysis for Bitcoin Cash (BCH)
- Support and resistance levels for Bitcoin Cash (BCH)
- Bitcoin Cash (BCH) 2025 Price Prediction Analysis
- Key Factors Influencing Price in 2025
- Bitcoin Cash (BCH) Price Prediction for 2026
- Bitcoin Cash (BCH) Price Prediction for 2027
- Bitcoin Cash (BCH) Price Prediction for 2028
- Bitcoin Cash (BCH) Price Prediction for 2029
- Bitcoin Cash (BCH) Price Prediction for 2030
- FAQs
Bitcoin Cash (BCH) Price Prediction 2025-2030 Overview
| Year | Minimum Price | Average Price | Maximum Price |
| 2025 | $430 | $460 | $520 |
| 2026 | $620 | $650 | $760 |
| 2027 | $920 | $950 | $1,100 |
| 2028 | $1,320 | $1,360 | $1,580 |
| 2029 | $1,830 | $1,900 | $2,270 |
| 2030 | $2,770 | $2,860 | $3,230 |
Bollinger Band Analysis for Bitcoin Cash (BCH)
 Bitcoin Cash (BCH) price chart (Source: TradingView
)
Bitcoin Cash (BCH) price chart (Source: TradingView
)
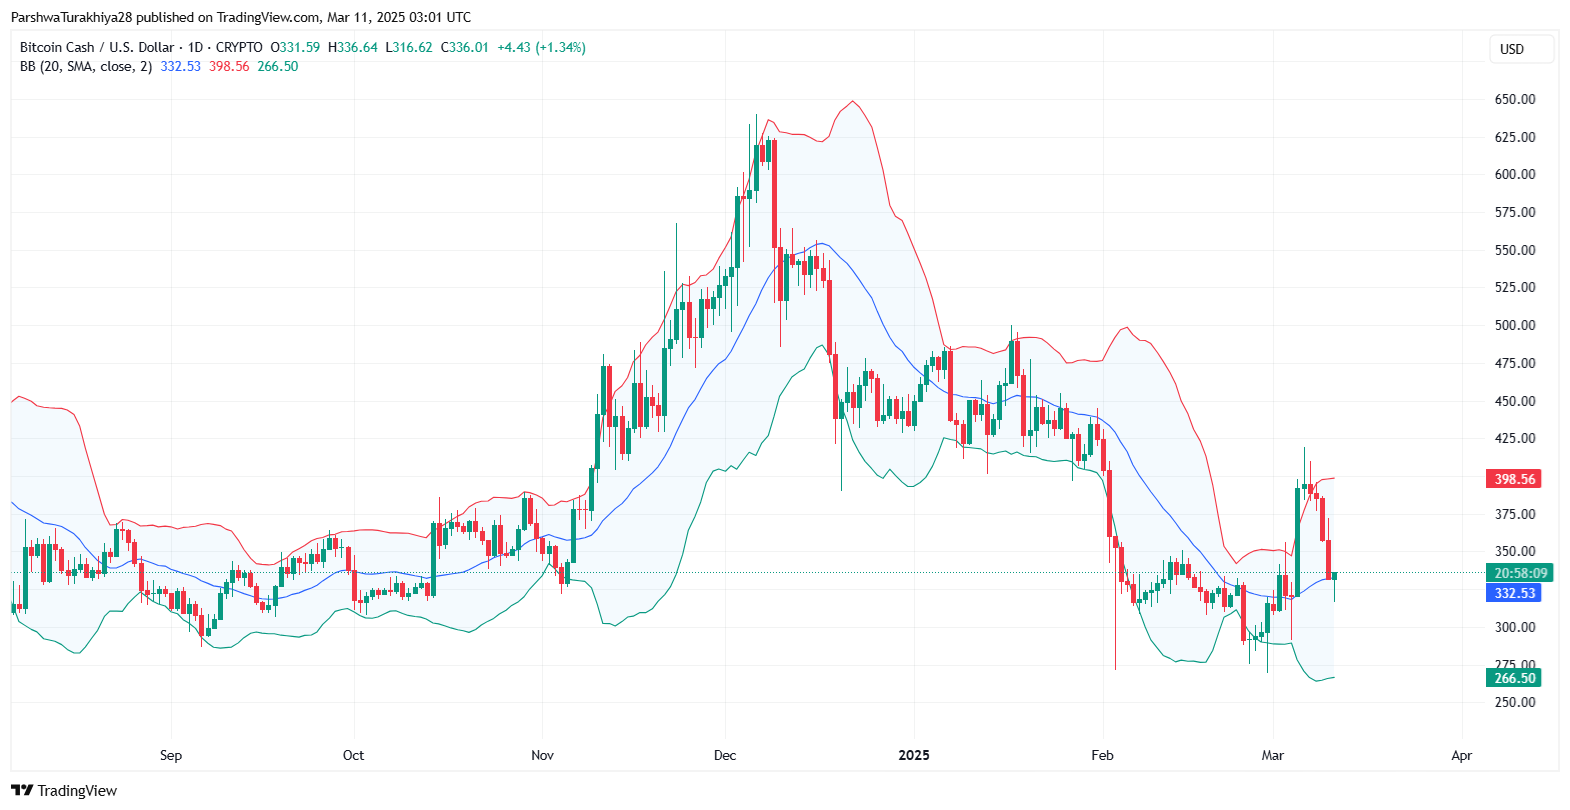
Bollinger Bands are used to measure volatility and identify potential breakouts or reversals. In the first chart, the Bollinger Bands (BB) are plotted with a 20-period simple moving average (SMA) as the midline, while the upper and lower bands are set at two standard deviations away.
Currently, BCH appears to have experienced increased volatility as indicated by the widening of the Bollinger Bands in previous months, particularly around December and January, when a sharp upward movement led to an overextended position near the upper band. Following this, price retraced, breaking below the midline (SMA), and has since been trading closer to the lower Bollinger Band. Recently, price touched the lower band and has bounced upward, suggesting a potential mean reversion or a short-term relief rally.
The most recent candlesticks show a price rejection from the lower band, indicating that BCH might be attempting to stabilize. However, the midline at around $332.53 acts as a near-term resistance, and a break above it would suggest further upside potential. Conversely, another test of the lower band near $266.50 could indicate a breakdown with increased selling pressure.
MACD Analysis for Bitcoin Cash (BCH)
 Bitcoin Cash (BCH) price chart (Source: TradingView
)
Bitcoin Cash (BCH) price chart (Source: TradingView
)
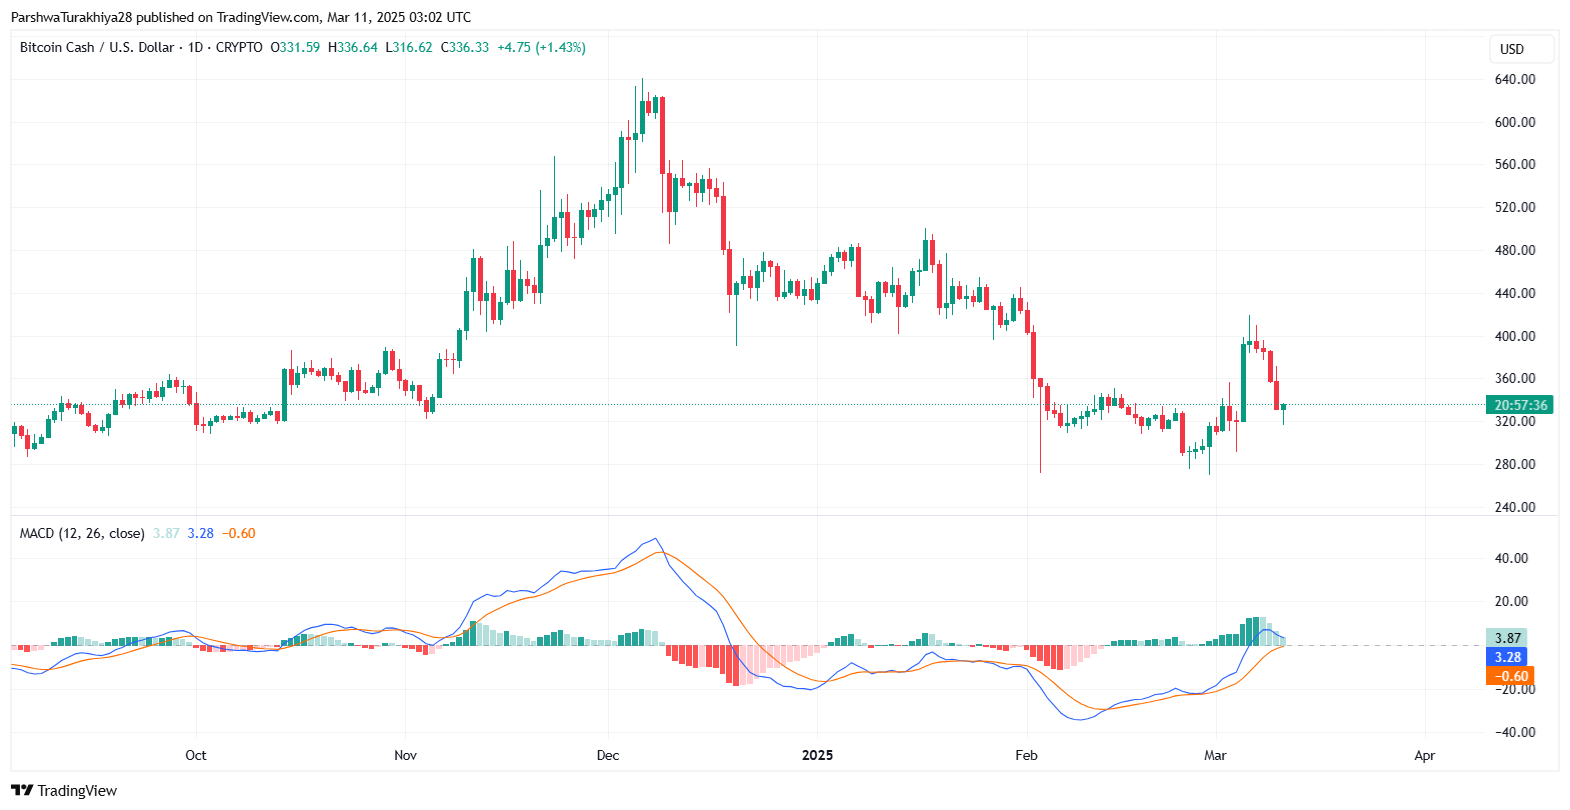
The MACD indicator helps in identifying trend direction and momentum shifts. Currently, the MACD line (12,26) is at 3.87, while the signal line is at 3.28, with a histogram reading of -0.60.
Previously, BCH experienced strong bullish momentum as seen in the positive MACD crossovers in November and December, where the MACD line remained above the signal line, confirming bullish momentum. However, the late-January bearish crossover marked the start of a downtrend, leading to extended selling pressure.
Currently, MACD is in a phase of potential reversal, as the histogram has moved closer to zero, suggesting that bearish momentum is weakening. However, the MACD line remains slightly above the signal line, indicating a neutral-to-slightly-bullish setup. If MACD sustains a positive crossover, it could confirm a continuation of the recovery trend. Traders should monitor whether the MACD line continues rising above the signal line, which could indicate the start of a new bullish cycle.
Relative Strength Index (RSI) Analysis for Bitcoin Cash (BCH)
 Bitcoin Cash (BCH) price dynamics (Source: TradingView
)
Bitcoin Cash (BCH) price dynamics (Source: TradingView
)
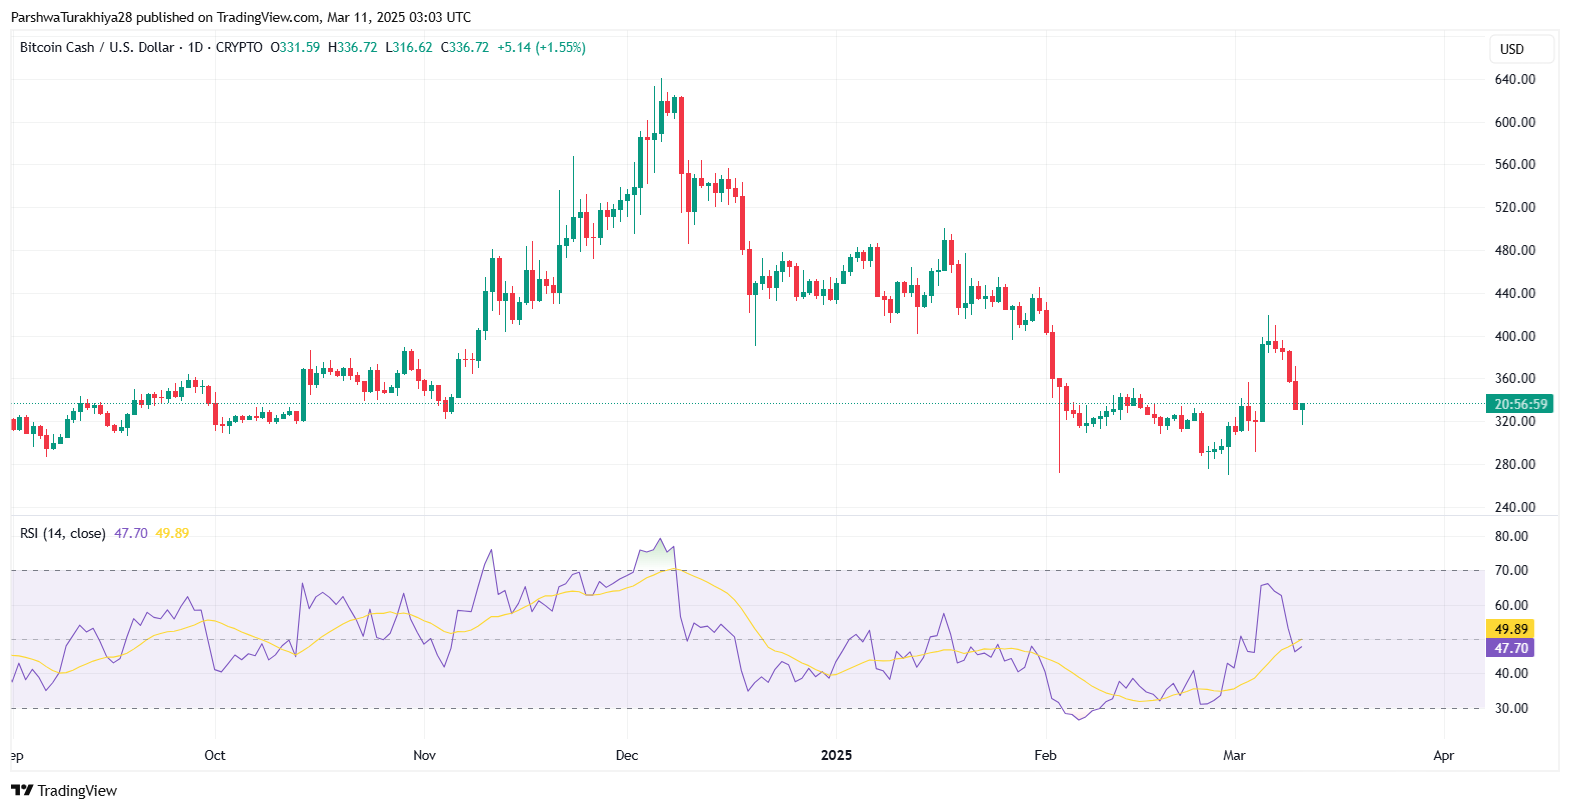
The RSI chart provides insights into momentum and overbought/oversold conditions. The RSI (14) is currently at 47.70, which is close to the neutral 50-level, suggesting a balanced market with no strong bullish or bearish bias.
Historically, BCH saw RSI moving into overbought levels above 70 during the December 2024 price surge, followed by a strong selloff that pushed RSI below 30, marking oversold conditions in February 2025. The recent recovery has pushed RSI towards the mid-range, suggesting that selling pressure has weakened, but bullish strength remains uncertain.
A sustained RSI move above 50 would indicate a strengthening bullish trend, with potential upside momentum. However, if RSI drops below 40, it could confirm further weakness and signal a retest of recent lows. Traders should watch for a breakout above 50, which could validate an uptrend towards 60-65, while failure to hold the 45-40 range could trigger another downward move.
Support and resistance levels for Bitcoin Cash (BCH)
 Bitcoin Cash (BCH) price chart (Source: TradingView
)
Bitcoin Cash (BCH) price chart (Source: TradingView
)
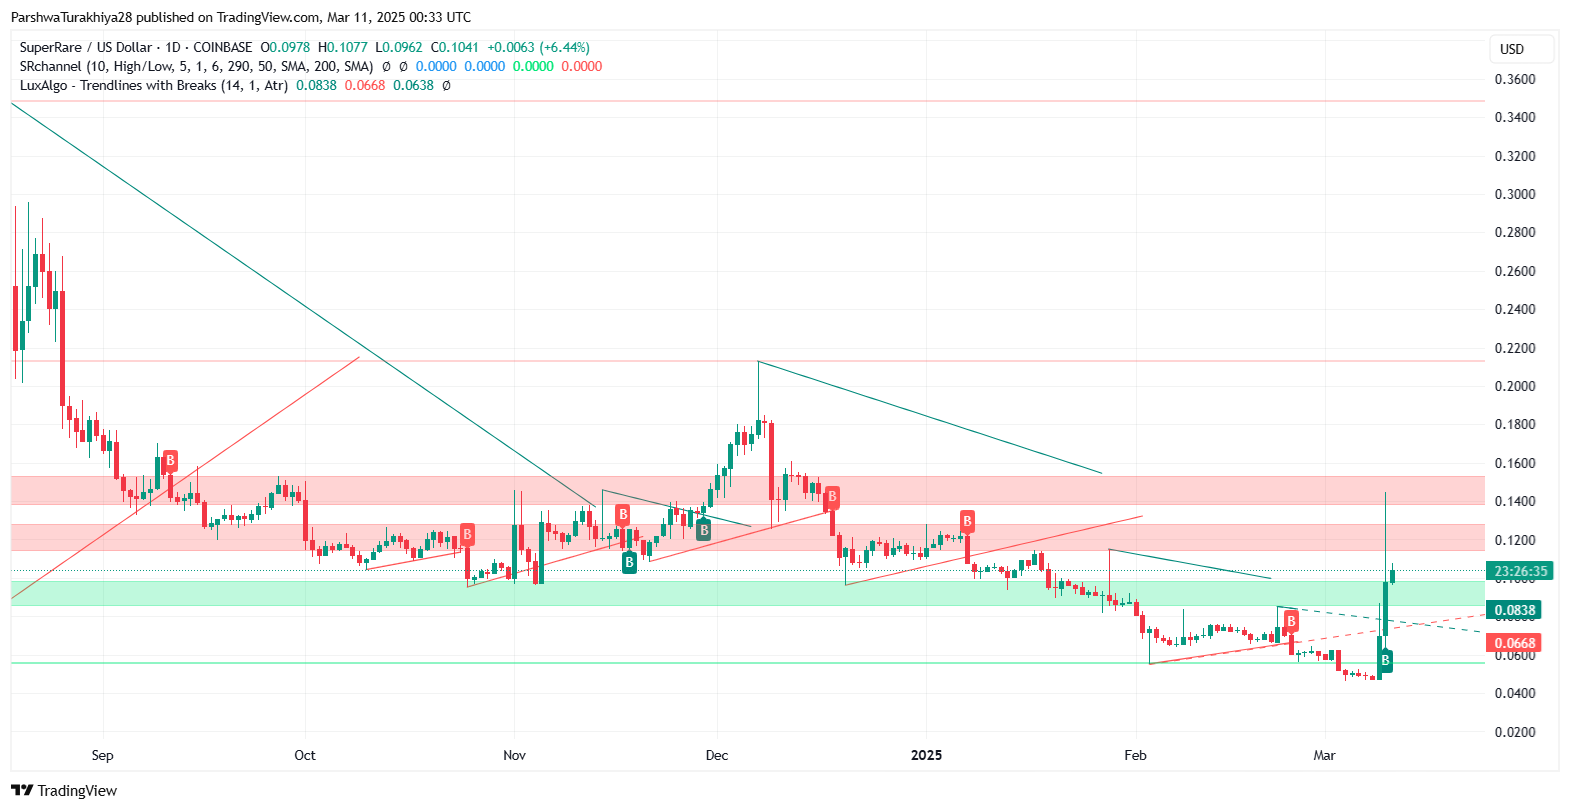
The support and resistance levels are identified using trendlines, price action, and previous reaction zones.
- Support Levels:
- $266 – $275 Zone: This is the lower Bollinger Band region, which acted as a strong support in the past. A break below this could lead to a major decline.
- $300 – $310 Zone: This was the previous accumulation zone before BCH attempted a breakout. If price consolidates above this, it could form a strong base for a potential rally.
- Resistance Levels:
- $332 – $340 Zone: The midline of the Bollinger Bands and a key level from previous price action. BCH needs to clear this level to confirm a short-term bullish trend.
- $398 – $400 Zone: This is the upper Bollinger Band and also a strong resistance zone where price previously failed to sustain a breakout.
- $420 – $450 Zone: The major resistance level that aligns with the trendline breakout from previous highs.
A successful breakout above $340 could drive BCH towards $398-$400, while a rejection from this region could result in a retest of $300-$310 support. The $266 level remains a crucial downside threshold; a breakdown below this could signal extended bearish pressure.
Bitcoin Cash (BCH) 2025 Price Prediction Analysis
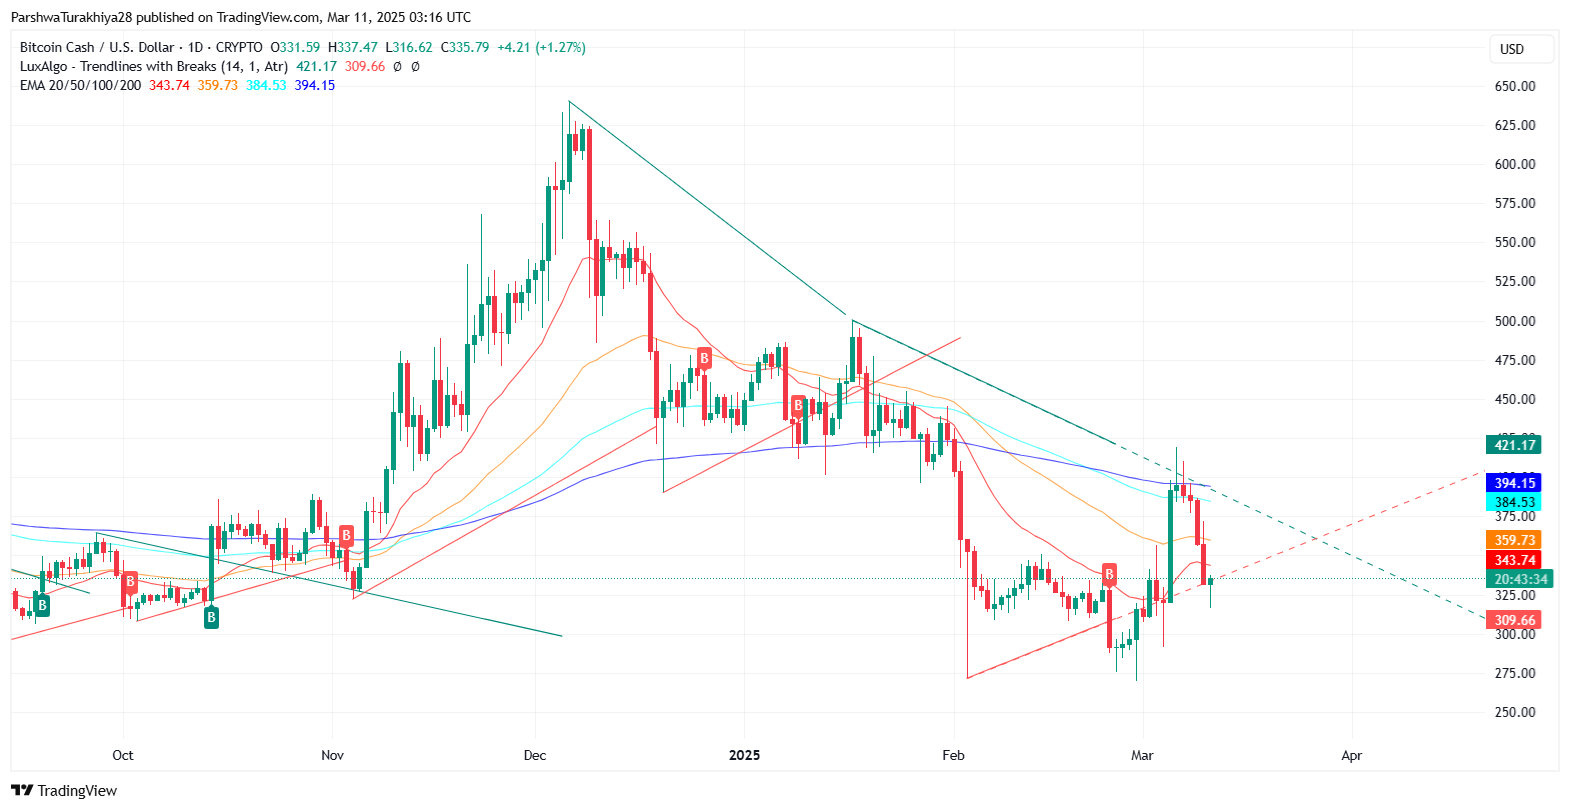 Bitcoin Cash (BCH) price analysis 2025 (Source: TradingView
)
Bitcoin Cash (BCH) price analysis 2025 (Source: TradingView
)
Bitcoin Cash (BCH) is currently exhibiting a consolidation phase with price action interacting around key exponential moving averages (EMAs). The EMA 20 (343.64), EMA 50 (359.69), EMA 100 (384.51), and EMA 200 (394.14) indicate that BCH remains in a recovery phase but is yet to break above major resistance levels. The presence of a downward trendline suggests that a breakout above $394-$400 would be necessary for a bullish continuation toward the $500+ range in 2025.
- Minimum Price: $430 – Given BCH’s current structure, the downside risk remains limited above the $300-$320 support zone, with $430 acting as the lower bound if market sentiment weakens.
- Average Price: $460 – Based on EMA trends and historical price action, BCH is expected to trade around this level for most of the year.
- Maximum Price: $520 – If BCH successfully breaks above resistance at $400-$420, it could test the $500-$520 range, aligning with historical breakout zones.
Key Factors Influencing Price in 2025
- EMA Structure & Trendline Resistance: BCH must sustain levels above $360-$380 to confirm bullish momentum. Failure to hold these levels could lead to sideways movement.
- Breakout Confirmation: A decisive move past $400-$420 would signal a trend reversal, opening the path to $500+.
- Market Sentiment & Bitcoin Correlation: BCH’s trajectory is closely tied to Bitcoin’s overall market cycle. A bullish Bitcoin market could drive BCH towards the upper price targets.
- Macroeconomic Factors & Adoption: Increased institutional interest and BCH’s role in peer-to-peer transactions could enhance long-term valuation.
Bitcoin Cash (BCH) Price Prediction for 2026
Bitcoin Cash is expected to gain momentum in 2026, supported by a recovering crypto market and increased adoption of blockchain-based payment solutions. The price is projected to trade within the $620-$760 range, with $650 as the average level. If Bitcoin follows a bullish trajectory, BCH could benefit from renewed investor confidence and a potential rally past $700. However, maintaining support above $600 will be crucial for sustained growth.
Bitcoin Cash (BCH) Price Prediction for 2027
By 2027, Bitcoin Cash may experience significant price appreciation, with forecasts placing it between $920 and $1,100. If BCH sustains higher transaction volumes and adoption in the payments industry, it could solidify its position above the $950 mark. However, market corrections and macroeconomic factors could introduce volatility, making $900 an important support level for maintaining bullish sentiment.
Bitcoin Cash (BCH) Price Prediction for 2028
Bitcoin Cash is likely to enter a stronger growth phase by 2028, with price predictions ranging between $1,320 and $1,580. As the global crypto market matures, BCH’s scalability and use case as a peer-to-peer payment system could drive demand. The ability to break past $1,500 will be key in determining whether BCH can enter a long-term bullish phase. Any pullbacks should ideally find support near $1,300 for stability.
Bitcoin Cash (BCH) Price Prediction for 2029
With a projected price range of $1,830-$2,270, BCH could see a surge in demand as mainstream crypto adoption increases. The market may witness increased integration of cryptocurrencies into financial services, potentially pushing BCH past $2,000. However, price swings will depend on market cycles and investor sentiment, with $1,900 acting as a key pivot level. Sustained bullish trends could set the stage for further upside.
Bitcoin Cash (BCH) Price Prediction for 2030
By 2030, Bitcoin Cash may establish itself as a widely accepted digital currency, with prices expected to reach $2,770 to $3,230. If institutional interest grows and BCH continues to be used in global transactions, it could surpass $3,000. However, the long-term trajectory will be influenced by regulatory developments and technological advancements in the blockchain space. Holding above $2,800 will be a strong indicator of further bullish momentum.
FAQs
Bitcoin Cash is projected to trade between $430 and $520 in 2025, with an average price of $460.
Key factors include market sentiment, Bitcoin’s price cycle, institutional adoption, and resistance breakouts above $400-$420.
If BCH clears $400 resistance and maintains bullish momentum, it could test the $500-$520 range by year-end.
Based on historical trends, the lowest BCH price in 2025 could be around $430, assuming strong market support.
BCH’s scalability, transaction speed, and potential adoption growth make it a promising asset, though price depends on broader market conditions.
Based on projections, BCH is unlikely to hit $1,000 in 2025, but long-term growth beyond 2027-2028 could push it toward that level.
Key resistance levels are $340, $398-$400, and $420-$450, which BCH needs to break to confirm a strong uptrend.
The $300-$320 zone is critical, with stronger downside support near $266-$275, aligned with past price action.
While Bitcoin remains dominant, BCH focuses on transaction efficiency. Its price is lower but could follow Bitcoin’s long-term uptrend.
If BCH reaches $520 from a low of $430, the potential ROI could be 34%, assuming a positive market cycle.
Disclaimer: The information presented in this article is for informational and educational purposes only. The article does not constitute financial advice or advice of any kind. Coin Edition is not responsible for any losses incurred as a result of the utilization of content, products, or services mentioned. Readers are advised to exercise caution before taking any action related to the company.
