Bitget: Top 4 in global daily trading volume!
Please also display BTC in AR60.77%
New listings on Bitget:Pi Network
Altcoin season index:0(Bitcoin season)
BTC/USDT$87638.02 (+0.22%)Fear at Greed Index40(Fear)
Total spot Bitcoin ETF netflow -$18.3M (1D); +$562.4M (7D).Coins listed in Pre-MarketPAWS,WCTWelcome gift package para sa mga bagong user na nagkakahalaga ng 6200 USDT.Claim now
Trade anumang oras, kahit saan gamit ang Bitget app. I-download ngayon

May kaugnayan sa coin
Price calculator
Kasaysayan ng presyo
Paghula ng presyo
Teknikal na pagsusuri
Gabay sa pagbili ng coin
kategorya ng Crypto
Profit calculator


NEAR Protocol presyoNEAR
Listed
Quote pera:
PHP
₱176.31+0.94%1D
Price chart
TradingView
Last updated as of 2025-03-27 02:46:28(UTC+0)
Market cap:₱211,145,698,630.8
Ganap na diluted market cap:₱211,145,698,630.8
Volume (24h):₱9,096,236,638.55
24h volume / market cap:4.30%
24h high:₱176.54
24h low:₱169.16
All-time high:₱1,174.84
All-time low:₱30.26
Umiikot na Supply:1,197,591,000 NEAR
Total supply:
1,242,041,667NEAR
Rate ng sirkulasyon:96.00%
Max supply:
--NEAR
Price in BTC:0.{4}3498 BTC
Price in ETH:0.001513 ETH
Price at BTC market cap:
Price at ETH market cap:
Mga kontrata:
0x1fa4...dee5d63(BNB Smart Chain (BEP20))
Higit pa
Ano ang nararamdaman mo tungkol sa NEAR Protocol ngayon?
Tandaan: Ang impormasyong ito ay para sa sanggunian lamang.
Presyo ng NEAR Protocol ngayon
Ang live na presyo ng NEAR Protocol ay ₱176.31 bawat (NEAR / PHP) ngayon na may kasalukuyang market cap na ₱211.15B PHP. Ang 24 na oras na dami ng trading ay ₱9.10B PHP. Ang presyong NEAR hanggang PHP ay ina-update sa real time. Ang NEAR Protocol ay 0.94% sa nakalipas na 24 na oras. Mayroon itong umiikot na supply ng 1,197,591,000 .
Ano ang pinakamataas na presyo ng NEAR?
Ang NEAR ay may all-time high (ATH) na ₱1,174.84, na naitala noong 2022-01-16.
Ano ang pinakamababang presyo ng NEAR?
Ang NEAR ay may all-time low (ATL) na ₱30.26, na naitala noong 2020-11-04.
Bitcoin price prediction
Ano ang magiging presyo ng NEAR sa 2026?
Batay sa makasaysayang modelo ng hula sa pagganap ng presyo ni NEAR, ang presyo ng NEAR ay inaasahang aabot sa ₱200.39 sa 2026.
Ano ang magiging presyo ng NEAR sa 2031?
Sa 2031, ang presyo ng NEAR ay inaasahang tataas ng +16.00%. Sa pagtatapos ng 2031, ang presyo ng NEAR ay inaasahang aabot sa ₱437.96, na may pinagsama-samang ROI na +148.38%.
NEAR Protocol price history (PHP)
The price of NEAR Protocol is -59.90% over the last year. The highest price of NEAR in PHP in the last year was ₱489.53 and the lowest price of NEAR in PHP in the last year was ₱124.82.
TimePrice change (%) Lowest priceHighest price
Lowest priceHighest price 24h+0.94%₱169.16₱176.54
7d+11.57%₱154.23₱176.79
30d+1.34%₱124.82₱204.4
90d-40.48%₱124.82₱357.56
1y-59.90%₱124.82₱489.53
All-time+154.21%₱30.26(2020-11-04, 4 taon na ang nakalipas )₱1,174.84(2022-01-16, 3 taon na ang nakalipas )
NEAR Protocol impormasyon sa merkado
NEAR Protocol's market cap history
NEAR Protocol market
NEAR Protocol holdings by concentration
Whales
Investors
Retail
NEAR Protocol addresses by time held
Holders
Cruisers
Traders
Live coinInfo.name (12) price chart

NEAR Protocol na mga rating
Mga average na rating mula sa komunidad
4.4
Ang nilalamang ito ay para sa mga layuning pang-impormasyon lamang.
NEAR sa lokal na pera
1 NEAR To MXN$61.931 NEAR To GTQQ23.641 NEAR To CLP$2,830.151 NEAR To HNLL78.581 NEAR To UGXSh11,260.031 NEAR To ZARR55.871 NEAR To TNDد.ت9.521 NEAR To IQDع.د4,024.161 NEAR To TWDNT$101.51 NEAR To RSDдин.333.681 NEAR To DOP$193.731 NEAR To MYRRM13.571 NEAR To GEL₾8.521 NEAR To UYU$129.011 NEAR To MADد.م.29.541 NEAR To AZN₼5.211 NEAR To OMRر.ع.1.181 NEAR To KESSh397.331 NEAR To SEKkr30.771 NEAR To UAH₴127.67
- 1
- 2
- 3
- 4
- 5
Last updated as of 2025-03-27 02:46:28(UTC+0)
Paano Bumili ng NEAR Protocol(NEAR)

Lumikha ng Iyong Libreng Bitget Account
Mag-sign up sa Bitget gamit ang iyong email address/mobile phone number at gumawa ng malakas na password para ma-secure ang iyong account.

Beripikahin ang iyong account
I-verify ang iyong pagkakakilanlan sa pamamagitan ng paglalagay ng iyong personal na impormasyon at pag-upload ng wastong photo ID.

Convert NEAR Protocol to NEAR
Gumamit ng iba't ibang mga pagpipilian sa pagbabayad upang bumili ng NEAR Protocol sa Bitget. Ipapakita namin sa iyo kung paano.
I-trade ang NEAR panghabang-buhay na hinaharap
Pagkatapos ng matagumpay na pag-sign up sa Bitget at bumili ng USDT o NEAR na mga token, maaari kang magsimulang mag-trading ng mga derivatives, kabilang ang NEAR futures at margin trading upang madagdagan ang iyong inccome.
Ang kasalukuyang presyo ng NEAR ay ₱176.31, na may 24h na pagbabago sa presyo ng +0.94%. Maaaring kumita ang mga trader sa pamamagitan ng alinman sa pagtagal o pagkukulang saNEAR futures.
Sumali sa NEAR copy trading sa pamamagitan ng pagsunod sa mga elite na traders.
Pagkatapos mag-sign up sa Bitget at matagumpay na bumili ng mga token ng USDT o NEAR, maaari ka ring magsimula ng copy trading sa pamamagitan ng pagsunod sa mga elite na traders.
NEAR Protocol balita

Notice on New Trading Pairs on Bitget Spot - 21 October 2024
Bitget Announcement•2024-10-18 10:00
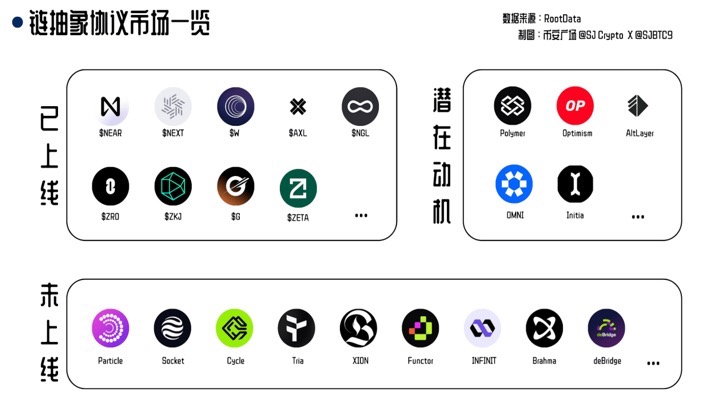
23 na mga protocol, isang pangkalahatang-ideya ng kasalukuyang pattern ng chain abstraction protocol
Eric SJ(重开版)•2024-09-02 06:41

Buy more


Ang mga tao ay nagtatanong din tungkol sa presyo ng NEAR Protocol.
Ano ang kasalukuyang presyo ng NEAR Protocol?
The live price of NEAR Protocol is ₱176.31 per (NEAR/PHP) with a current market cap of ₱211,145,698,630.8 PHP. NEAR Protocol's value undergoes frequent fluctuations due to the continuous 24/7 activity in the crypto market. NEAR Protocol's current price in real-time and its historical data is available on Bitget.
Ano ang 24 na oras na dami ng trading ng NEAR Protocol?
Sa nakalipas na 24 na oras, ang dami ng trading ng NEAR Protocol ay ₱9.10B.
Ano ang all-time high ng NEAR Protocol?
Ang all-time high ng NEAR Protocol ay ₱1,174.84. Ang pinakamataas na presyong ito sa lahat ng oras ay ang pinakamataas na presyo para sa NEAR Protocol mula noong inilunsad ito.
Maaari ba akong bumili ng NEAR Protocol sa Bitget?
Oo, ang NEAR Protocol ay kasalukuyang magagamit sa sentralisadong palitan ng Bitget. Para sa mas detalyadong mga tagubilin, tingnan ang aming kapaki-pakinabang na gabay na Paano bumili ng .
Maaari ba akong makakuha ng matatag na kita mula sa investing sa NEAR Protocol?
Siyempre, nagbibigay ang Bitget ng estratehikong platform ng trading, na may mga matatalinong bot sa pangangalakal upang i-automate ang iyong mga pangangalakal at kumita ng kita.
Saan ako makakabili ng NEAR Protocol na may pinakamababang bayad?
Ikinalulugod naming ipahayag na ang estratehikong platform ng trading ay magagamit na ngayon sa Bitget exchange. Nag-ooffer ang Bitget ng nangunguna sa industriya ng mga trading fee at depth upang matiyak ang kumikitang pamumuhunan para sa mga trader.
Saan ako makakabili ng NEAR Protocol (NEAR)?
Video section — quick verification, quick trading

How to complete identity verification on Bitget and protect yourself from fraud
1. Log in to your Bitget account.
2. If you're new to Bitget, watch our tutorial on how to create an account.
3. Hover over your profile icon, click on “Unverified”, and hit “Verify”.
4. Choose your issuing country or region and ID type, and follow the instructions.
5. Select “Mobile Verification” or “PC” based on your preference.
6. Enter your details, submit a copy of your ID, and take a selfie.
7. Submit your application, and voila, you've completed identity verification!
Ang mga investment sa Cryptocurrency, kabilang ang pagbili ng NEAR Protocol online sa pamamagitan ng Bitget, ay napapailalim sa market risk. Nagbibigay ang Bitget ng madali at convenient paraan para makabili ka ng NEAR Protocol, at sinusubukan namin ang aming makakaya upang ganap na ipaalam sa aming mga user ang tungkol sa bawat cryptocurrency na i-eooffer namin sa exchange. Gayunpaman, hindi kami mananagot para sa mga resulta na maaaring lumabas mula sa iyong pagbili ng NEAR Protocol. Ang page na ito at anumang impormasyong kasama ay hindi isang pag-endorso ng anumang partikular na cryptocurrency.
PlatformAI & Big DataStakingCoinbase Ventures PortfolioThree Arrows Capital PortfolioArrington XRP Capital PortfolioCoinfund PortfolioElectric Capital PortfolioFabric Ventures PortfolioKenetic Capital PortfolioNear Protocol EcosystemCross-ChainInjective EcosystemCircle Ventures PortfolioLayer 1Alleged SEC SecuritiesAccount AbstractionData AvailabilityCMC Crypto Yearbook 2024-25Made in America
Bitget Insights

Nusrat_Mim_CryptoQue
2h
ETH/USDT Market Analysis & Future Outlook
Current Price: $2,009.58 (-2.65%)
24H Range: $1,982.26 - $2,078.29
Market Sentiment: Bearish with signs of short-term recovery
Technical Overview
The ETH/USDT pair has been in a downtrend, reaching a recent low of $1,982.26. However, a slight rebound is visible, indicating possible accumulation near support.
Indicators Analysis
🔹 Moving Averages (MA):
Short-term MAs (10, 20) show bearish momentum.
Resistance near MA(50) at $2,007.87.
🔹 MACD (12,26,9):
MACD line (-1.55) below the signal line (-13.74), indicating downward pressure.
A potential crossover in a lower timeframe could hint at reversal.
🔹 RSI (Relative Strength Index):
RSI(6): 43.08
RSI(12): 38.20
RSI(24): 40.93
Indicates oversold conditions, suggesting a bounce might be coming.
🔹 KDJ (9,3,3):
K: 50.13, D: 36.22, J: 77.95
Strong volatility, a possible reversal signal.
Future Prediction Based on Different Timeframes
📉 Short-Term (1H - 4H):
Expect a minor rebound toward $2,020-$2,030 before testing lower support.
Resistance: $2,046
Support: $1,982
📈 Mid-Term (Daily):
If ETH holds above $1,982, a recovery toward $2,100 is possible.
Failure to break resistance could lead to another drop to $1,950-$1,970.
⚠️ Risk Factors:
High volatility due to macroeconomic conditions.
Uncertain market sentiment.
Conclusion
ETH is showing signs of consolidation, with potential for a short-term bounce. However, traders should remain cautious and watch key support/resistance levels. A confirmed breakout above $2,046 could signal a bullish reversal, while failure to hold $1,982 might lead to further downside.
What’s your ETH price target this week? Share your thoughts below!$ETH
HOLD+0.64%
ETH+0.82%

Learn-To-Earn
2h
🚀 $PARTI Gaining Momentum – Bulls in Action! 🚀
🔹 Current Price: $0.3385 (+4.77%)
🔹 24H Range: High: $0.4100 | Low: $0.3108
🔹 24H Volume: 344.32M PARTI
📊 Key Levels:
🔸 Support: $0.3108 – Holding strong
🔸 Resistance: $0.3600 – Next breakout level
📈 Trade Setup:
✔️ Bullish Trend: A push above $0.3600 could trigger more upside
✔️ Pullback Risk: Watch for consolidation near $0.3300
⚡ Market Outlook: Strong volume suggests further movement—keep an eye on the breakout! 🚀
$PARTI
PARTI+8.58%
NEAR+2.74%

Crypto-Worm
2h
XRP Rises to $2.46 Amid Bullish Predictions and SEC Settlement
$XRP is currently trading at $2.46, marking a 1.66% increase over the past 24 hours, according to CoinMarketCap. This positive momentum is driven by bullish forecasts from analysts and renewed market confidence following the SEC’s decision to drop its appeal in the Ripple lawsuit.
Analyst Projections: A Push Toward Price Discovery?
Crypto analyst EGRAG CRYPTO has outlined multiple price targets for XRP based on historical price movements and Fibonacci extension levels. If XRP follows past market cycles, it could surpass the $3.40 resistance level, potentially entering price discovery mode, where new all-time highs may be reached.
Technical Indicators: What’s Next for XRP?
Bollinger Bands: $XRP is trading near its middle band, signaling potential consolidation before a breakout. A move toward the upper band at $2.58 could indicate a bullish trend, while a drop below $2.09 may suggest downside risk.
Relative Strength Index (RSI): At 52.91, XRP remains in neutral territory, leaving room for further upward movement. If RSI surpasses 60, it could confirm stronger bullish momentum.
Market Sentiment Boosted by SEC Settlement
Ripple Labs has reached a $50 million settlement with the SEC, bringing an end to a long-standing legal battle over XRP’s classification as a security. This resolution has eased uncertainty for investors, reinforcing XRP’s long-term potential.
MOVE-1.22%
XRP+1.37%
Learn-To-Earn
2h
$PEPE/USDT – Bouncing Back! 🚀🐸
Current Price: $0.00000847 (+5.48%)
24H High: $0.00000926 | 24H Low: $0.00000796
Key Support Levels: $0.00000820, $0.00000790
Key Resistance Levels: $0.00000860, $0.00000890
Trade Setup:
Long Entry Zone: $0.00000830 – $0.00000850
Target Levels: $0.00000870, $0.00000900
Stop Loss: $0.00000810
Market Outlook: PEPE is gaining momentum after finding support near $0.00000800! If it breaks above $0.00000860, a push toward $0.00000900 is likely. Stay sharp! 🚀🔥
$PEPE
NEAR+2.74%
PEPE+0.82%

Cointelegraph
3h
🚨 LATEST: Bitcoin’s rally to a two-week high near $88K may be a classic bull trap, as low trading volume, negative funding rates, and macro uncertainty suggest weak bullish conviction.
Analysts warn the market remains fragile, with little real momentum from retail or institutional players.
NEAR+2.74%
S+3.44%
Mga kaugnay na asset
Mga sikat na cryptocurrencies
Isang seleksyon ng nangungunang 8 cryptocurrencies ayon sa market cap.


Kamakailang idinagdag
Ang pinakahuling idinagdag na cryptocurrency.


NEAR Protocol Social Data
Sa nakalipas na 24 na oras, ang marka ng sentimento ng social media para sa NEAR Protocol ay 3, at ang trend ng presyo ng social media patungo sa NEAR Protocol ay Bullish. Ang overall na marka ng social media ng NEAR Protocol ay 0, na nagra-rank ng 214 sa lahat ng cryptocurrencies.
Ayon sa LunarCrush, sa nakalipas na 24 na oras, binanggit ang mga cryptocurrencies sa social media nang 1,058,120 (na) beses, na binanggit ang NEAR Protocol na may frequency ratio na 0.04%, na nagra-rank ng 51 sa lahat ng cryptocurrencies.
Sa nakalipas na 24 na oras, mayroong total 525 na natatanging user na tumatalakay sa NEAR Protocol, na may kabuuang NEAR Protocol na pagbanggit ng 414. Gayunpaman, kumpara sa nakaraang 24 na oras, ang bilang ng mga natatanging user bumaba ng 0%, at ang kabuuang bilang ng mga pagbanggit ay pagtaas ng 17%.
Sa Twitter, mayroong kabuuang 0 na tweet na nagbabanggit ng NEAR Protocol sa nakalipas na 24 na oras. Kabilang sa mga ito, ang 0% ay bullish sa NEAR Protocol, 0% ay bearish sa NEAR Protocol, at ang 100% ay neutral sa NEAR Protocol.
Sa Reddit, mayroong 51 na mga post na nagbabanggit ng NEAR Protocol sa nakalipas na 24 na oras. Kung ikukumpara sa nakaraang 24 na oras, ang bilang ng mga pagbanggit bumaba ng 18% . Bukod pa rito, mayroong 0 na komento na nagbabanggit ng NEAR Protocol. Kung ikukumpara sa nakaraang 24 na oras, ang bilang ng mga pagbanggit ay bumaba ng 0%.
Lahat ng panlipunang pangkalahatang-ideya
3