Bitget: топ-4 за щоденним обсягом торгівлі!
Частка ринку BTC60.69%
Нові лістинги на Bitget:Pi Network
Індекс сезону альткоїнів:0(Сезон Bitcoin)
BTC/USDT$83955.16 (+1.01%)Індекс страху та жадібності32(Страх)
Total spot Bitcoin ETF netflow -$59.2M (1D); -$1.37B (7D).Монети, що представлені на премаркетіPAWS,WCTВітальний подарунковий пакет для нових користувачів вартістю 6200 USDT.Отримати
Торгуйте в будь-який час у будь-якому місці через застосунок Bitget. Завантажити

Пов'язано з монетами
Калькулятор цін
Історія цін
Прогноз ціни
Технічний аналіз
Посібник з купівлі монет
Категорія криптовалют
Калькулятор прибутку


Ціна BUZZCoinBUZZ
Не представлено на платформі
Валюта котирування:
USD
Дані отримані від сторонніх постачальників. Ця сторінка та надана на ній інформація не є висловленням підтримки жодної конкретної криптовалюти. Хочете торгувати монетами, представленими на біржі? Клацніть тут
$0.{4}3240-0.00%1D
Графік цін
Останнє оновлення 2025-03-17 21:00:47(UTC+0)
Ринкова капіталізація:--
Повністю розбавлена ринкова капіталізація:--
Обсяг (24 г):--
Обсяг за 24 г / Ринкова капіталізація:0.00%
Макс. за 24 г:$0.{4}3240
Мін. за 24 год:$0.{4}3240
Історичний максимум:$0.002991
Історичний мінімум:$0.{5}1318
Циркулююча пропозиція:-- BUZZ
Загальна пропозиція:
20,000,000,000BUZZ
Показник обігу:0.00%
Максимальна пропозиція:
--BUZZ
Ціна в BTC:0.{9}3860 BTC
Ціна в ETH:0.{7}1675 ETH
Ціна за ринковою капіталізацією BTC:
--
Ціна за ринковою капіталізацією ETH:
--
Контракти:--
Як ви ставитеся до BUZZCoin сьогодні?
Примітка. Ця інформація надається лише для ознайомлення.
Ціна BUZZCoin сьогодні
Ціна BUZZCoin в реальному часі становить $0.{4}3240 за (BUZZ / USD) за сьогодні з поточною ринковою капіталізацією $0.00 USD. Обсяг торгівлі за 24 години становить $0.00 USD. Ціна від BUZZ до USD оновлюється в режимі реального часу. BUZZCoin становить -0.00% за останні 24 години. Циркулююча пропозиція 0 .
Яка найвища ціна BUZZ?
Історичний максимум (ATH) BUZZ становить $0.002991, зафіксований 2017-09-20.
Яка найнижча ціна BUZZ?
Історичний мінімум (ATL) BUZZ становить $0.{5}1318, зафіксований 2024-07-05.
Прогноз для ціни BUZZCoin
Коли найкраще купувати BUZZ? Чи варто купувати або продавати BUZZ зараз?
Коли ви вирішуєте, купувати чи продавати BUZZ, необхідно спершу врахувати власну торгову стратегію. Торгова активність довгострокових і короткострокових трейдерів також буде відрізнятися. Технічний аналіз BUZZ від Bitget може надати вам орієнтир для торгівлі.
Згідно з Технічний аналіз BUZZ за 4 год., торговий сигнал — Продати.
Згідно з Технічний аналіз BUZZ за 1 день, торговий сигнал — Купити.
Згідно з Технічний аналіз BUZZ за 1 тиждень, торговий сигнал — Купити.
Якою буде ціна BUZZ у 2026?
Ґрунтуючись на моделі прогнозування історичних показників BUZZ, ціна BUZZ може досягти $0.{4}2936 у $0.{4}2936 році.
Якою буде ціна BUZZ у 2031?
У 2031 ціна BUZZ може зрости на +2.00%. Прогнозується, що до кінця 2031 ціна BUZZ досягне $0.{4}6744, а сукупна ROI становитиме +108.16%.
Історія цін BUZZCoin (USD)
За останній рік ціна BUZZCoin зросла на +68.64%. Найвища ціна в USD минулого року була $0.{4}3383, а найнижча ціна в USD — $0.{5}1318.
ЧасЗміна ціни (%) Найнижча цінаНайвища ціна
Найнижча цінаНайвища ціна 24h-0.00%$0.{4}3240$0.{4}3240
7d-0.00%$0.{4}3240$0.{4}3240
30d-0.00%$0.{4}3240$0.{4}3240
90d+56.03%$0.{4}1619$0.{4}3383
1y+68.64%$0.{5}1318$0.{4}3383
За весь час-89.31%$0.{5}1318(2024-07-05, 256 дні(в) тому )$0.002991(2017-09-20, 7 р. тому )
Ринкові дані BUZZCoin
Історія ринкової капіталізації BUZZCoin
Утримання BUZZCoin за концентрацією
Кити
Інвестори
Рітейл
Адреси BUZZCoin за часом утримання
Холдери
Cruisers
Трейдери
Графік ціни coinInfo.name (12) у режимі реального часу

Оцінки BUZZCoin
Середні оцінки від спільноти
4.4
Цей контент призначено лише для інформаційних цілей.
BUZZ до місцевої валюти
1 BUZZ до MXN$01 BUZZ до GTQQ01 BUZZ до CLP$0.031 BUZZ до UGXSh0.121 BUZZ до HNLL01 BUZZ до ZARR01 BUZZ до TNDد.ت01 BUZZ до IQDع.د0.041 BUZZ до TWDNT$01 BUZZ до RSDдин.01 BUZZ до DOP$01 BUZZ до MYRRM01 BUZZ до GEL₾01 BUZZ до UYU$01 BUZZ до MADد.م.01 BUZZ до AZN₼01 BUZZ до OMRر.ع.01 BUZZ до SEKkr01 BUZZ до KESSh01 BUZZ до UAH₴0
- 1
- 2
- 3
- 4
- 5
Останнє оновлення 2025-03-17 21:00:47(UTC+0)
BUZZCoin новин

Оголошено переможців хакатону Solana AI, The Hive (BUZZ) визнано найкращим проєктом
Bitget•2025-01-16 02:50
Сьогоднішній популярний інвентар MEME
币币皆然 •2025-01-10 10:20
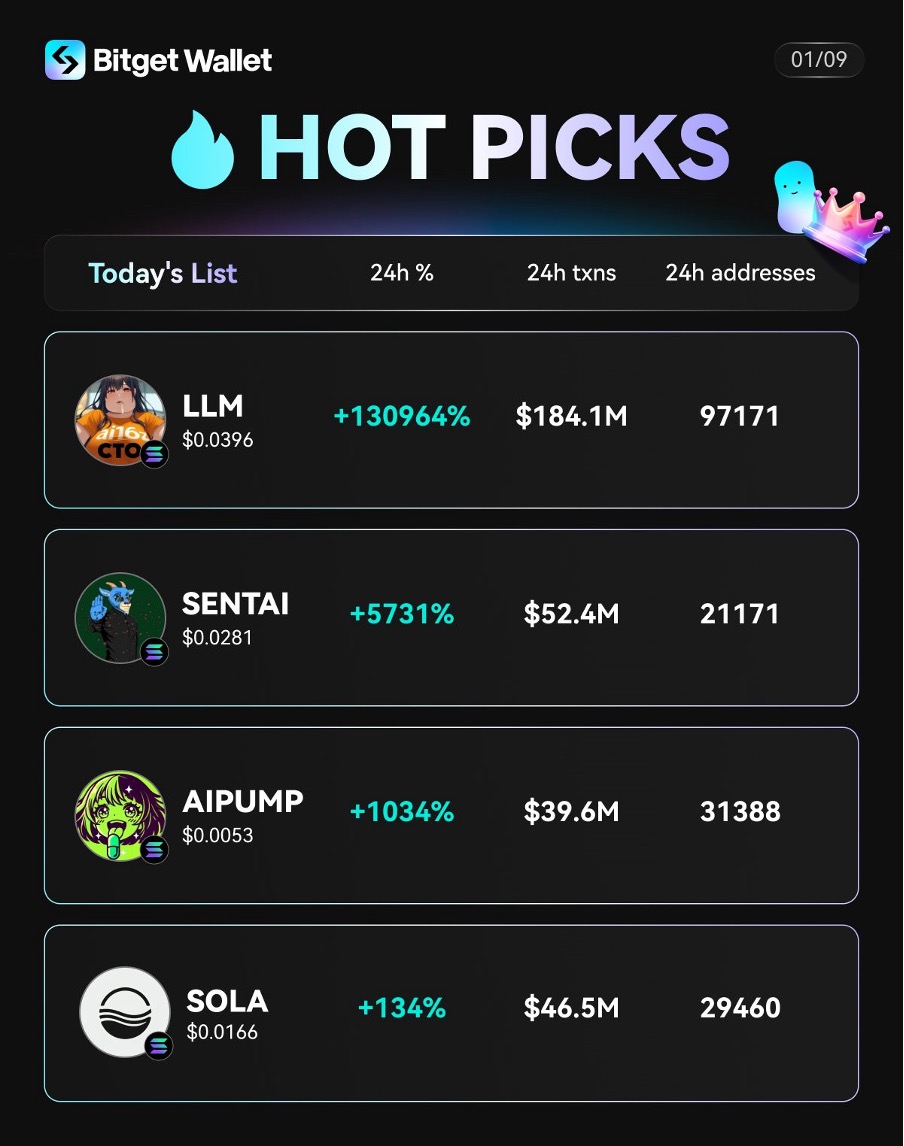
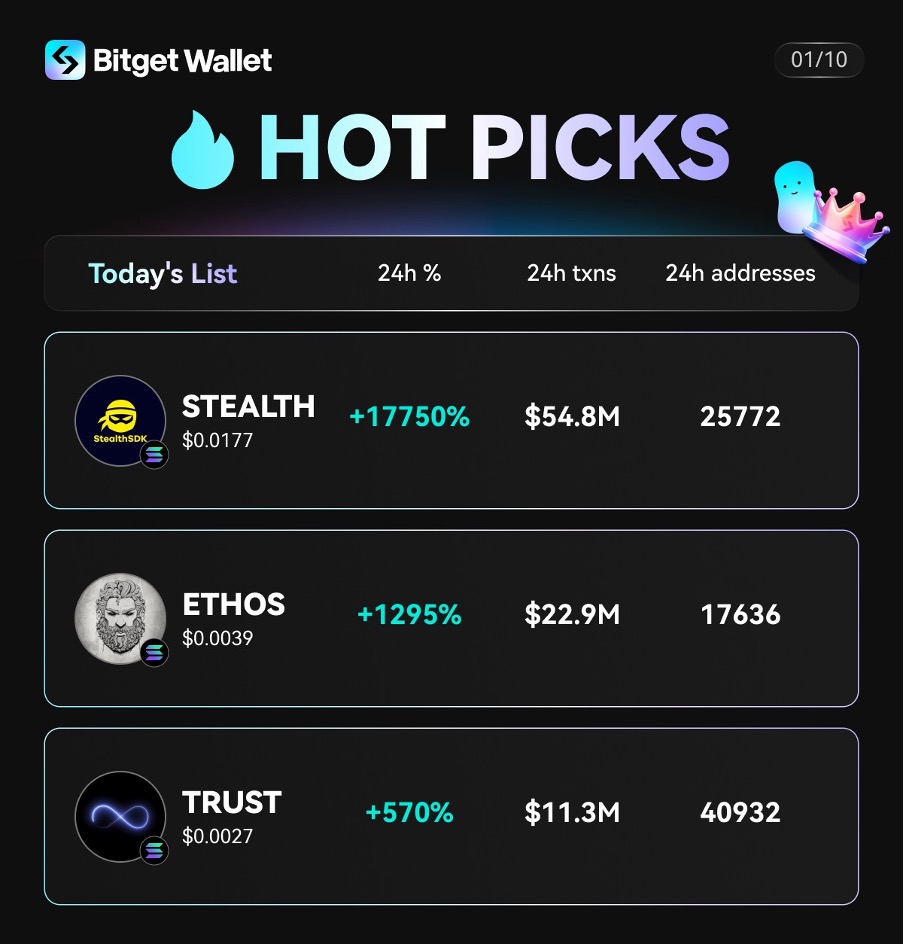
Сьогоднішній популярний інвентар MEME
币币皆然 •2025-01-09 08:51

Купити більше


Поширені запитання
Яка поточна ціна BUZZCoin?
Актуальна ціна BUZZCoin становить $0 за (BUZZ/USD), актуальна ринкова капіталізація становить $0 USD. Вартість BUZZCoin часто коливається через безперервну активність на криптовалютному ринку. Актуальну ціну BUZZCoin в режимі реального часу та дані на історії ви завжди можете переглянути на Bitget.
Який обсяг торгівлі BUZZCoin за 24 години?
За останні 24 години обсяг торгівлі BUZZCoin становить $0.00.
Який історичний максимум BUZZCoin?
Історичний максимум BUZZCoin становить $0.002991. Цей історичний максимум є найвищою ціною для BUZZCoin з моменту його запуску.
Чи можу я купити BUZZCoin на Bitget?
Так, BUZZCoin зараз можна придбати на централізованій біржі Bitget. Щоб отримати докладніші інструкції, перегляньте наш корисний посібник Як купити .
Чи можу я отримувати постійний дохід від інвестування в BUZZCoin?
Звичайно, Bitget забезпечує платформа для стратегічної торгівлі з розумними торговими ботами для автоматизації ваших угод і отримання прибутку.
Де можна купити BUZZCoin за найнижчою комісією?
Ми раді повідомити, що платформа для стратегічної торгівлі тепер доступний на Bitget. Bitget пропонує найкращі комісії за торгівлю та глибину ринку, щоб забезпечити прибутковість інвестицій для трейдерів.
Де можна купити криптовалюту?
Купуйте криптовалюту в застосунку Bitget
Щоб купити криптовалюту за допомогою кредитної картки або банківського переказу, вам потрібно зареєструватися. Це займе всього кілька хвилин.
Video section — Швидка верифікація, швидке здійснення угод

Як пройти верифікацію особи на Bitget та захистити себе від шахрайства
1. Увійдіть у свій акаунт Bitget.
2. Якщо ви ще не маєте акаунта на Bitget, перегляньте нашу інструкцію.
3. Наведіть курсор на значок вашого профілю, клацніть «Не верифікований», а потім «Верифікувати».
4. Оберіть країну або регіон, де ви отримали посвідчення особи, та тип посвідчення. Далі дотримуйтесь підказок на екрані.
5. Виберіть «Верифікація з мобільного» або «ПК».
6. Введіть свої дані, надішліть копію посвідчення особи та зробіть селфі.
7. Після цього подайте заявку, та все готово.
Інвестиції в криптовалюту, включаючи купівлю BUZZCoin онлайн через Bitget, підлягають ринковому ризику. Bitget надає вам прості та зручні способи купівлі BUZZCoin, і ми намагаємося максимально повно інформувати наших користувачів про кожну криптовалюту, яку ми пропонуємо на біржі. Однак ми не несемо відповідальності за результати, які можуть виникнути в результаті купівлі BUZZCoin. Ця сторінка та будь-яка інформація, що тут міститься, не є схваленням будь-якої конкретної криптовалюти.
Ресурси BUZZ
Теги:
Доступний для майнінгу
Доступний для майнінгу
Bitget Insights
IamTrymeoo
13год
#BREAKING: Pi Network Users Left Stunned as Coins Vanish from Mainnet - What's Happening?
There's been a recent buzz around Pi Network, with some users reporting that their Pi coins have been returned from the mainnet to the application. This phenomenon has left many wondering what's behind this sudden change.
It appears that some Pi coins that were successfully transferred to the mainnet and reflected in the Pi Wallet have now been returned to the mining app with a "Returned" status. This means that the coins are no longer on the blockchain and need to be migrated again.
Possible causes for this reversal include migration errors, which might be due to a system bug that reversed some transactions. However, it's essential to note that the Pi Network is still in its development phase, and such issues are not uncommon.
In June 2024, the Pi Core Team returned over 9 million Pi Coins from wallets back to the application, aiming to enhance network integrity and ensure fair distribution. While this move was seen as a positive step towards transparency and fairness, the recent reports of Pi coins being returned from the mainnet have sparked concerns among users.
If you're affected by this issue, it's recommended that you check your Pi app for any updates or notifications regarding the migration process. You can also refer to the Pi Network's official resources or community forums for more information and guidance.
CORE+7.31%
MOVE+3.33%

BGUSER-QZHZGCP4
20год
*Analyzing Bullish and Bearish Momentum for $BMT: A Comprehensive Guide*
$BMT
To analyze the bullish and bearish momentum of a specific token like $BMT, you would typically look at several key indicators and factors. In this article, we'll break down the essential elements to consider when evaluating the momentum of $BMT.
*1. Price Trends*
Price trends are a crucial indicator of momentum. To identify trends, you can use tools like moving averages (e.g., 50-day MA, 200-day MA).
- *Bullish Momentum*: If the price of $BMT is consistently making higher highs and higher lows, this is a sign of bullish momentum. If the price is above key moving averages, it's generally considered bullish.
- *Bearish Momentum*: If the price is making lower highs and lower lows, this indicates bearish momentum. A price below key moving averages is often a bearish signal.
*2. Volume Analysis*
Volume analysis is another essential factor in determining momentum.
- *Bullish Momentum*: Increasing trading volume on upward price movements can confirm bullish momentum. High volume during price increases suggests strong buying interest.
- *Bearish Momentum*: Increasing volume on downward price movements can confirm bearish momentum. High volume during price declines suggests strong selling pressure.
*3. Technical Indicators*
Technical indicators can provide valuable insights into momentum.
- *Relative Strength Index (RSI)*:
- *Bullish*: RSI above 50 and trending upwards, especially if it's below 70 (overbought territory).
- *Bearish*: RSI below 50 and trending downwards, especially if it's above 30 (oversold territory).
- *Moving Average Convergence Divergence (MACD)*:
- *Bullish*: MACD line above the signal line and both above zero.
- *Bearish*: MACD line below the signal line and both below zero.
- *Bollinger Bands*:
- *Bullish*: Price touching or breaking above the upper band.
- *Bearish*: Price touching or breaking below the lower band.
*4. Market Sentiment*
Market sentiment can significantly impact momentum.
- *Bullish Momentum*: Positive news, partnerships, or developments related to $BMT can drive bullish sentiment. Social media buzz, increased mentions, and positive sentiment analysis can also be indicators.
- *Bearish Momentum*: Negative news, regulatory concerns, or poor project developments can lead to bearish sentiment. Increased FUD (Fear, Uncertainty, Doubt) in the community can also be a sign.
*5. On-Chain Metrics*
On-chain metrics can provide valuable insights into momentum.
- *Bullish Momentum*: Increasing number of active addresses, higher transaction volumes, and growth in the number of large holders (whales) can indicate bullish momentum.
- *Bearish Momentum*: Decreasing active addresses, lower transaction volumes, and large holders selling off their tokens can indicate bearish momentum.
*6. Support and Resistance Levels*
Support and resistance levels can help identify momentum.
- *Bullish Momentum*: Breaking through key resistance levels with strong volume can be a bullish signal.
- *Bearish Momentum*: Falling below key support levels with strong volume can be a bearish signal.
*7. Market Structure*
Market structure can provide valuable insights into momentum.
- *Bullish Momentum*: A clear uptrend with higher highs and higher lows.
- *Bearish Momentum*: A clear downtrend with lower highs and lower lows.
*Example Analysis*
If $BMT is currently trading above its 50-day and 200-day moving averages, with an RSI around 60 and increasing trading volume on upward price movements, this would suggest bullish momentum. Conversely, if $BMT is below these moving averages, with an RSI around 40 and increasing volume on downward movements, this would suggest bearish momentum.
*Conclusion*
To get a precise analysis of $BMT's bullish or bearish momentum, you would need to look at real-time data and charts. Tools like TradingView, CoinMarketCap, or CoinGecko can provide the necessary data and indicators to make an informed assessment. If you have specific data or charts for $BMT, feel free to share, and I can help you interpret them!
*Recommendation*
Based on our analysis, we recommend that:
- *Traders*: Monitor the price action closely and adjust trading strategies accordingly.
- *Investors*: Consider the long-term potential of $BMT and adjust investment strategies accordingly.
- *Market Enthusiasts*: Stay informed about market developments and adjust strategies accordingly.
By following these recommendations and staying informed about market developments, traders, investors, and market enthusiasts can make more informed decisions and navigate the complexities of the cryptocurrency market.
SOCIAL0.00%
FUD+1.41%
BGUSER-QZHZGCP4
20год
*The Dance of Demand and Volatility: Understanding $BMT Price Fluctuations*
$BMT
The $BMT (BioMeta Token) exists within the dynamic and often unpredictable realm of cryptocurrency, where price fluctuations are intrinsically linked to market demand. Unraveling this relationship is crucial for anyone seeking to understand the token's trajectory.
*Demand as the Primary Driver*
At its core, the price of $BMT, like any asset, is primarily driven by supply and demand. Increased demand, with a relatively stable or decreasing supply, leads to price appreciation. Conversely, a decrease in demand leads to price depreciation.
Several factors contribute to the demand for $BMT:
- *Project Progress and Adoption*: Positive developments within the BioMeta ecosystem, such as successful partnerships, technological advancements, or increased platform adoption, generate excitement and drive demand.
- *Real-World Utility*: The real-world utility of $BMT within the BioMeta platform is a significant long-term demand driver. If the token is used frequently, demand will increase.
- *Market Sentiment and Speculation*: Positive news, social media buzz, and overall market sentiment can fuel speculative trading, leading to surges in demand. Conversely, negative news or FUD (fear, uncertainty, and doubt) can trigger sell-offs and decrease demand.
- *Broader Cryptocurrency Market Trends*: The overall health of the cryptocurrency market significantly impacts the demand for $BMT. Bullish market conditions often lead to increased demand for altcoins like $BMT, while bearish conditions can have the opposite effect.
- *Exchange Listings and Accessibility*: Listings on major cryptocurrency exchanges increase the accessibility of $BMT, potentially leading to higher trading volumes and increased demand.
*The Impact of Price Fluctuations on Demand*
The relationship between price fluctuations and demand is often cyclical:
- *Price Surges and FOMO (Fear of Missing Out)*: Rapid price increases can trigger FOMO, leading to a surge in demand as traders seek to capitalize on perceived gains.
- *Price Corrections and Panic Selling*: Sharp price corrections can induce panic selling, leading to a decrease in demand and further price declines.
- *Price Stability and Confidence*: Periods of relative price stability can build confidence among investors, potentially leading to increased long-term demand.
*Analyzing the Volatility*
$BMT's price fluctuations are influenced by:
- *Low Liquidity*: Depending on the exchange and time of day, $BMT may experience periods of low liquidity, which can amplify price swings.
- *News and Events*: Announcements related to the BioMeta project, regulatory developments, or broader market events can trigger rapid price fluctuations.
- *Whale Activity*: Large transactions by whales (holders of significant amounts of $BMT) can significantly impact the token's price.
*Strategies for Navigating Demand and Volatility*
To navigate the complex relationship between demand and volatility, consider the following strategies:
- *Fundamental Analysis*: Conduct thorough research on the BioMeta project, its technology, and its team. Assess the long-term potential of the project and the utility of the $BMT token.
- *Technical Analysis*: Use price charts and technical indicators to identify trends and potential entry and exit points.
- *Risk Management*: Only invest what you can afford to lose. Set stop-loss orders to limit potential losses. Diversify your portfolio.
- *Stay Informed*: Keep up-to-date with news and developments related to the BioMeta project and the broader cryptocurrency market.
*Where to Monitor $BMT Demand and Price*
To stay informed about $BMT's demand and price, monitor the following sources:
- *Cryptocurrency Exchanges*: Monitor trading volumes and order books on exchanges where $BMT is listed.
- *Cryptocurrency Price Tracking Websites*: Use websites like CoinMarketCap and CoinGecko to track price movements and market capitalization.
- *Social Media and Online Forums*: Monitor discussions and sentiment related to $BMT on platforms like Twitter, Reddit, and Telegram.
By understanding the complex relationship between demand and volatility, you can make more informed decisions about $BMT and navigate the dynamic world of cryptocurrency.
*Recommendation*
Based on our analysis, we recommend that:
- *Traders*: Monitor the price action closely and adjust trading strategies accordingly.
- *Investors*: Consider the long-term potential of $BMT and adjust investment strategies accordingly.
- *Market Enthusiasts*: Stay informed about market developments and adjust strategies accordingly.
By following these recommendations and staying informed about market developments, traders, investors, and market enthusiasts can make more informed decisions and navigate the complexities of the cryptocurrency market.
SOCIAL0.00%
FUEL+21.80%
BGUSER-QZHZGCP4
20год
*Analyzing Bullish and Bearish Momentum for $BMT: A Comprehensive Guide*
$BMT
To analyze the bullish and bearish momentum of a specific token like $BMT, you would typically look at several key indicators and factors. In this article, we'll break down the essential elements to consider when evaluating the momentum of $BMT.
*1. Price Trends*
Price trends are a crucial indicator of momentum. To identify trends, you can use tools like moving averages (e.g., 50-day MA, 200-day MA).
- *Bullish Momentum*: If the price of $BMT is consistently making higher highs and higher lows, this is a sign of bullish momentum. If the price is above key moving averages, it's generally considered bullish.
- *Bearish Momentum*: If the price is making lower highs and lower lows, this indicates bearish momentum. A price below key moving averages is often a bearish signal.
*2. Volume Analysis*
Volume analysis is another essential factor in determining momentum.
- *Bullish Momentum*: Increasing trading volume on upward price movements can confirm bullish momentum. High volume during price increases suggests strong buying interest.
- *Bearish Momentum*: Increasing volume on downward price movements can confirm bearish momentum. High volume during price declines suggests strong selling pressure.
*3. Technical Indicators*
Technical indicators can provide valuable insights into momentum.
- *Relative Strength Index (RSI)*:
- *Bullish*: RSI above 50 and trending upwards, especially if it's below 70 (overbought territory).
- *Bearish*: RSI below 50 and trending downwards, especially if it's above 30 (oversold territory).
- *Moving Average Convergence Divergence (MACD)*:
- *Bullish*: MACD line above the signal line and both above zero.
- *Bearish*: MACD line below the signal line and both below zero.
- *Bollinger Bands*:
- *Bullish*: Price touching or breaking above the upper band.
- *Bearish*: Price touching or breaking below the lower band.
*4. Market Sentiment*
Market sentiment can significantly impact momentum.
- *Bullish Momentum*: Positive news, partnerships, or developments related to $BMT can drive bullish sentiment. Social media buzz, increased mentions, and positive sentiment analysis can also be indicators.
- *Bearish Momentum*: Negative news, regulatory concerns, or poor project developments can lead to bearish sentiment. Increased FUD (Fear, Uncertainty, Doubt) in the community can also be a sign.
*5. On-Chain Metrics*
On-chain metrics can provide valuable insights into momentum.
- *Bullish Momentum*: Increasing number of active addresses, higher transaction volumes, and growth in the number of large holders (whales) can indicate bullish momentum.
- *Bearish Momentum*: Decreasing active addresses, lower transaction volumes, and large holders selling off their tokens can indicate bearish momentum.
*6. Support and Resistance Levels*
Support and resistance levels can help identify momentum.
- *Bullish Momentum*: Breaking through key resistance levels with strong volume can be a bullish signal.
- *Bearish Momentum*: Falling below key support levels with strong volume can be a bearish signal.
*7. Market Structure*
Market structure can provide valuable insights into momentum.
- *Bullish Momentum*: A clear uptrend with higher highs and higher lows.
- *Bearish Momentum*: A clear downtrend with lower highs and lower lows.
*Example Analysis*
If $BMT is currently trading above its 50-day and 200-day moving averages, with an RSI around 60 and increasing trading volume on upward price movements, this would suggest bullish momentum. Conversely, if $BMT is below these moving averages, with an RSI around 40 and increasing volume on downward movements, this would suggest bearish momentum.
*Conclusion*
To get a precise analysis of $BMT's bullish or bearish momentum, you would need to look at real-time data and charts. Tools like TradingView, CoinMarketCap, or CoinGecko can provide the necessary data and indicators to make an informed assessment. If you have specific data or charts for $BMT, feel free to share, and I can help you interpret them!
*Recommendation*
Based on our analysis, we recommend that:
- *Traders*: Monitor the price action closely and adjust trading strategies accordingly.
- *Investors*: Consider the long-term potential of $BMT and adjust investment strategies accordingly.
- *Market Enthusiasts*: Stay informed about market developments and adjust strategies accordingly.
By following these recommendations and staying informed about market developments, traders, investors, and market enthusiasts can make more informed decisions and navigate the complexities of the cryptocurrency market.
SOCIAL0.00%
FUD+1.41%

Yaseen_rehman
22год
BMT**Price Trends**
$BMT To analyze the bullish and bearish momentum of a specific token like $BMT, you would typically look at several key indicators and factors. Here's a breakdown of what you might consider:
### 1. **Price Trends**
- **Bullish Momentum**: If the price of $BMT is consistently making higher highs and higher lows, this is a sign of bullish momentum. You can use tools like moving averages (e.g., 50-day MA, 200-day MA) to identify trends. If the price is above these averages, it’s generally considered bullish.
- **Bearish Momentum**: If the price is making lower highs and lower lows, this indicates bearish momentum. A price below key moving averages is often a bearish signal.
### 2. **Volume Analysis**
- **Bullish Momentum**: Increasing trading volume on upward price movements can confirm bullish momentum. High volume during price increases suggests strong buying interest.
- **Bearish Momentum**: Increasing volume on downward price movements can confirm bearish momentum. High volume during price declines suggests strong selling pressure.
### 3. **Technical Indicators**
- **Relative Strength Index (RSI)**:
- **Bullish**: RSI above 50 and trending upwards, especially if it’s below 70 (overbought territory).
- **Bearish**: RSI below 50 and trending downwards, especially if it’s above 30 (oversold territory).
- **Moving Average Convergence Divergence (MACD)**:
- **Bullish**: MACD line above the signal line and both above zero.
- **Bearish**: MACD line below the signal line and both below zero.
- **Bollinger Bands**:
- **Bullish**: Price touching or breaking above the upper band.
- **Bearish**: Price touching or breaking below the lower band.
### 4. **Market Sentiment**
- **Bullish Momentum**: Positive news, partnerships, or developments related to $BMT can drive bullish sentiment. Social media buzz, increased mentions, and positive sentiment analysis can also be indicators.
- **Bearish Momentum**: Negative news, regulatory concerns, or poor project developments can lead to bearish sentiment. Increased FUD (Fear, Uncertainty, Doubt) in the community can also be a sign.
### 5. **On-Chain Metrics**
- **Bullish Momentum**: Increasing number of active addresses, higher transaction volumes, and growth in the number of large holders (whales) can indicate bullish momentum.
- **Bearish Momentum**: Decreasing active addresses, lower transaction volumes, and large holders selling off their tokens can indicate bearish momentum.
### 6. **Support and Resistance Levels**
- **Bullish Momentum**: Breaking through key resistance levels with strong volume can be a bullish signal.
- **Bearish Momentum**: Falling below key support levels with strong volume can be a bearish signal.
### 7. **Market Structure**
- **Bullish Momentum**: A clear uptrend with higher highs and higher lows.
- **Bearish Momentum**: A clear downtrend with lower highs and lower lows.
### Example Analysis:
If $BMT is currently trading above its 50-day and 200-day moving averages, with an RSI around 60 and increasing trading volume on upward price movements, this would suggest bullish momentum. Conversely, if $BMT is below these moving averages, with an RSI around 40 and increasing volume on downward movements, this would suggest bearish momentum.
### Conclusion:
To get a precise analysis of $BMT's bullish or bearish momentum, you would need to look at real-time data and charts. Tools like TradingView, CoinMarketCap, or CoinGecko can provide the necessary data and indicators to make an informed assessment.
If you have specific data or charts for $BMT, feel free to share, and I can help you interpret them!
SOCIAL0.00%
FUD+1.41%
Пов'язані активи
Популярні криптовалюти
Підбірка з 8 найкращих криптовалют за ринковою капіталізацією.


Нещодавно додано
Останні додані криптовалюти.


Порівнювана ринкова капіталізація
Серед усіх активів на Bitget ці 8 найближчі до BUZZCoin за ринковою капіталізацією.


Соціальні дані про BUZZCoin
За останні 24 години оцінка настрою в соціальних мережах щодо BUZZCoin склала 3, а оцінка настрою в соціальних мережах щодо цінового тренду BUZZCoin — Бичачий. Загальна оцінка BUZZCoin в соціальних мережах склала 0, що відповідає 2258 серед усіх криптовалют.
За даними LunarCrush, за останні 24 години криптовалюти згадувалися в соціальних мережах загалом 1,058,120 разів, при цьому BUZZCoin згадувався з частотою 0%, посідаючи 2258 місце серед усіх криптовалют.
За останні 24 години 48 унікальних користувачів обговорювали BUZZCoin, і загалом 18 згадували BUZZCoin. Однак, порівняно з попереднім 24-годинним періодом, кількість унікальних користувачів зростає на 109%, а загальна кількість згадок зростає на 500%.
У Twitter за останні 24 години було 0 твітів, в яких згадується BUZZCoin. Серед них, 0% є бичачими для BUZZCoin, 0% — ведмежими для BUZZCoin, а 100% — нейтральними для BUZZCoin.
За останні 24 години на Reddit зʼявилося 0 дописів, в яких згадується BUZZCoin. Порівняно з попереднім 24-годинним періодом кількість згадок падає на 0%. Крім того, було 0 коментарів, у яких згадується BUZZCoin. Порівняно з попереднім 24-годинним періодом, кількість згадок падає на 0%.
Огляд соцмереж
3